| 1) How do I quantify this (how much fluorescence)? |
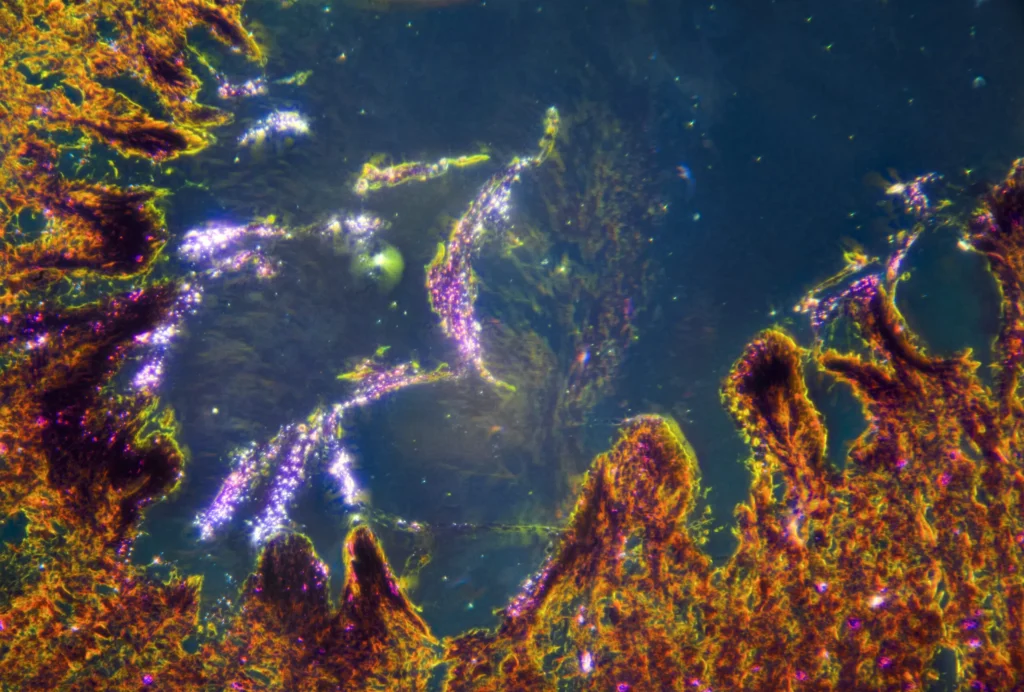
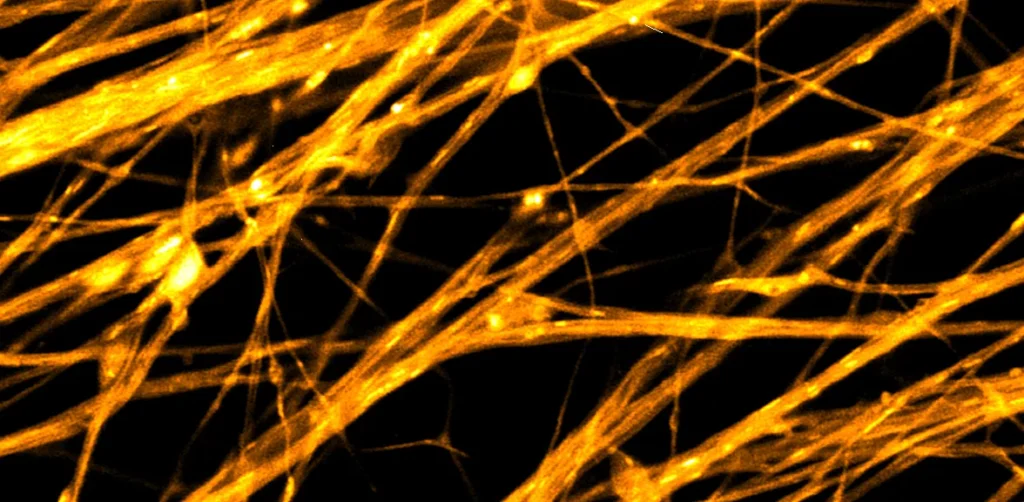
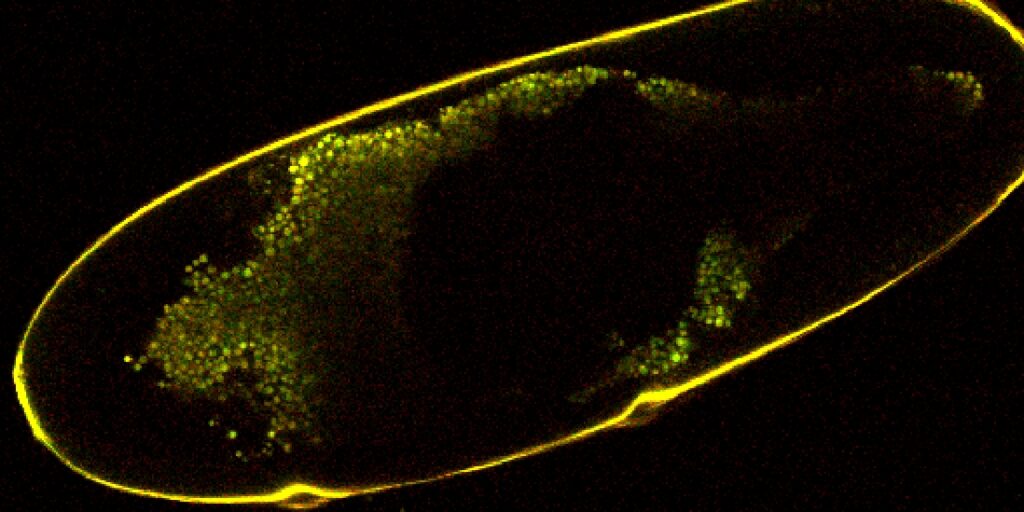
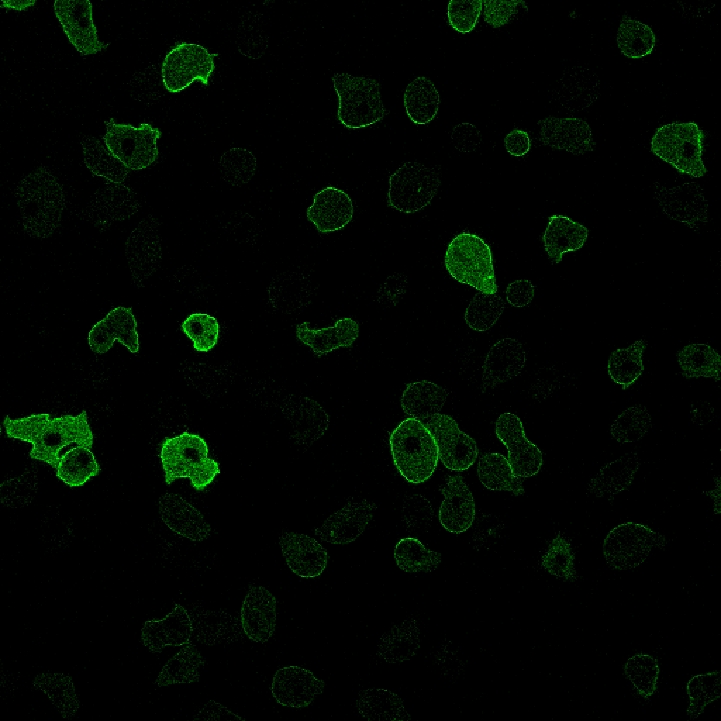
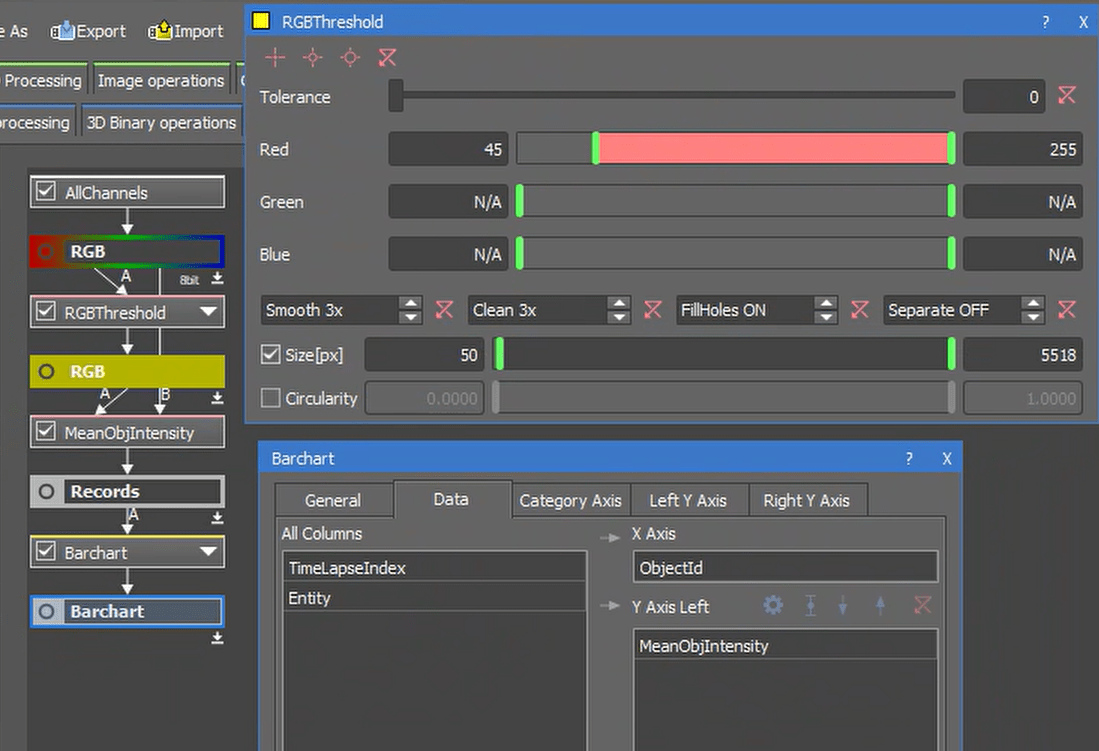
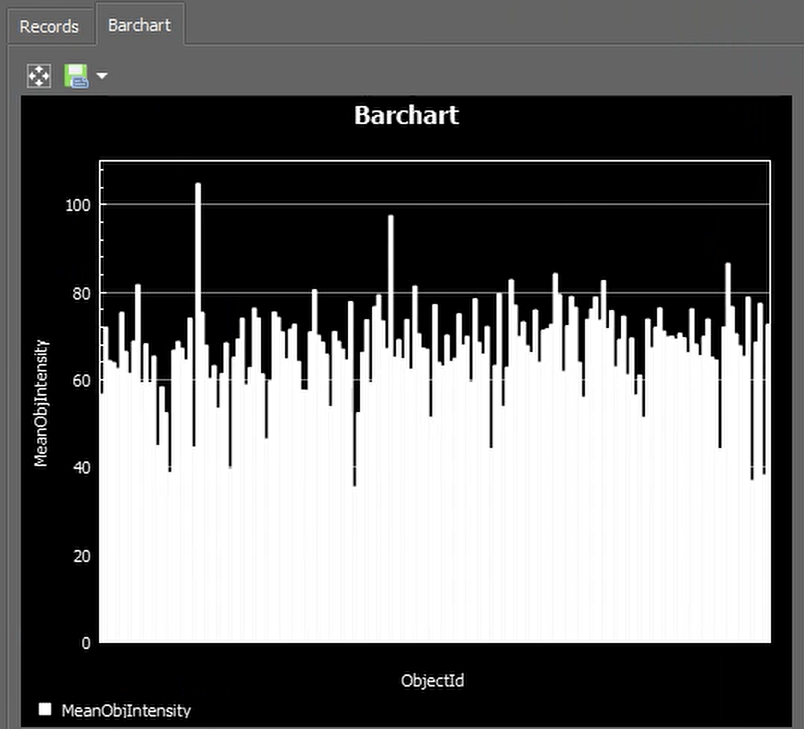
| The problem here is that fluorescence values depend on how you took the image, so it is hard to compare two images taken with different microscope settings. To quantify fluorescence for comparing objects within the same image, first perform an object segmentation. Once you are happy with how objects are classified, use Mean Obj Intensity from Measurement (can also measure Max, Min, median, stdev, and variance if wanted). This will create a table that shows the mean fluorescence of each object. In the Data Management tab, there are statistical tests you can use on the data. The Results tab includes graphs you can connect to the table to better present the data. |
  |
| 2) How can I count these cells? |
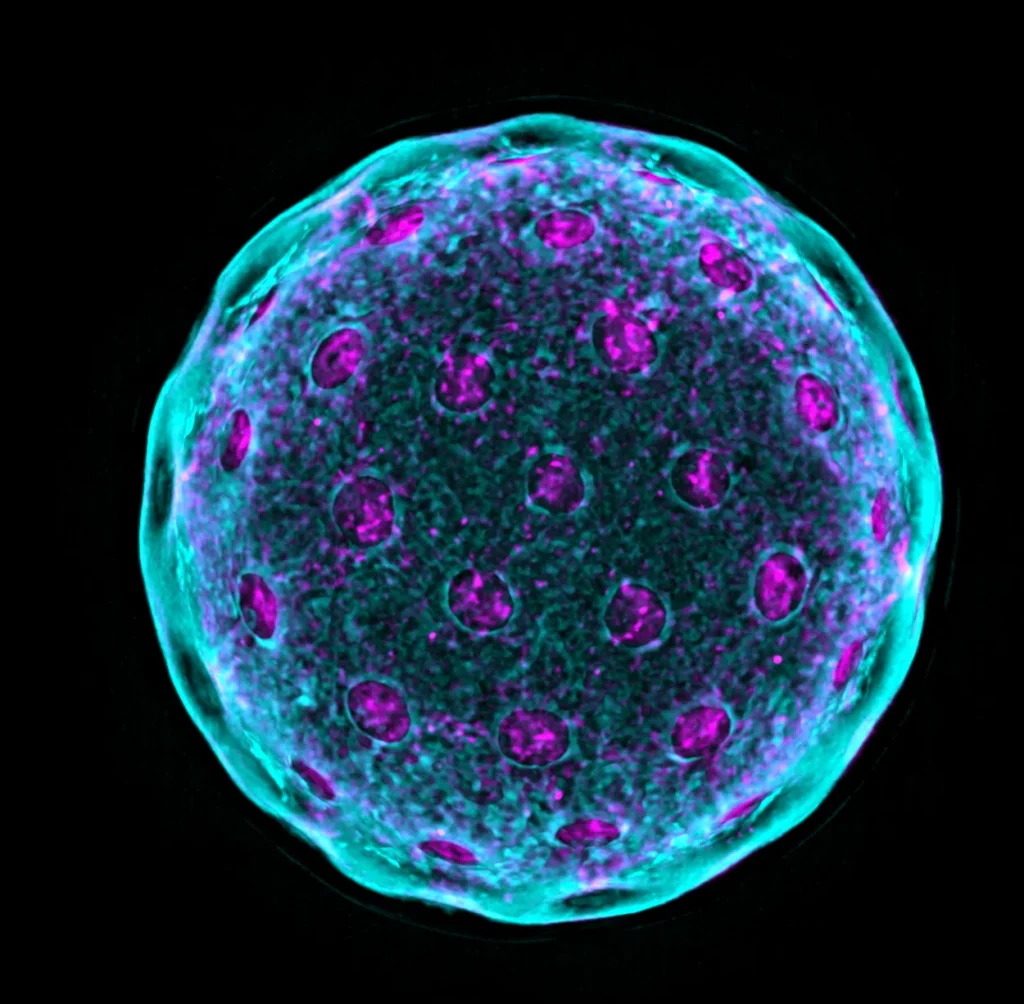
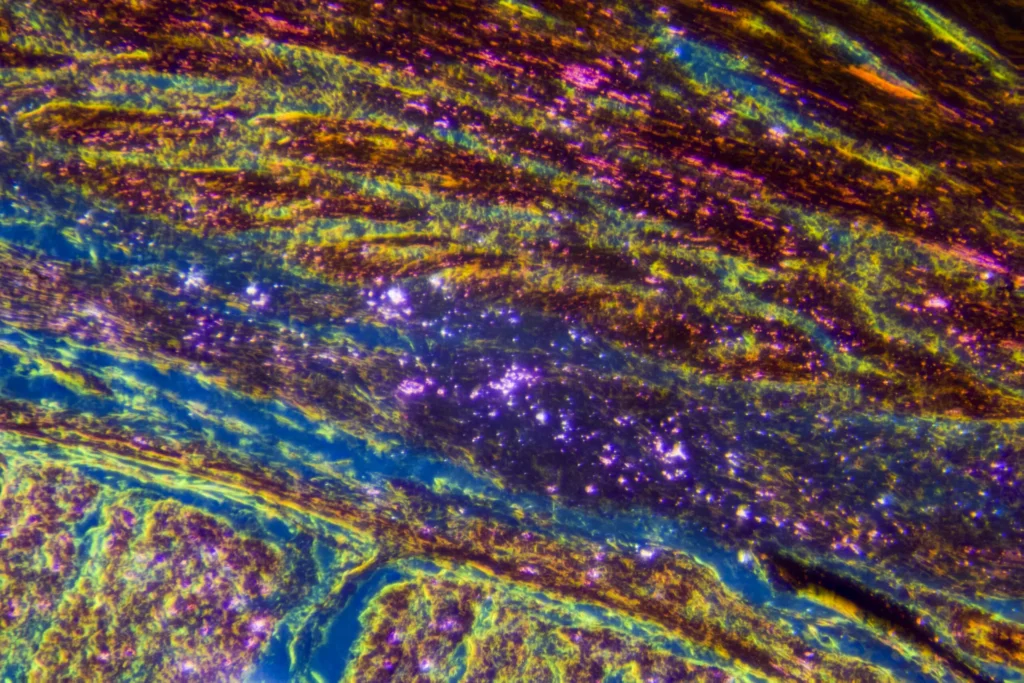
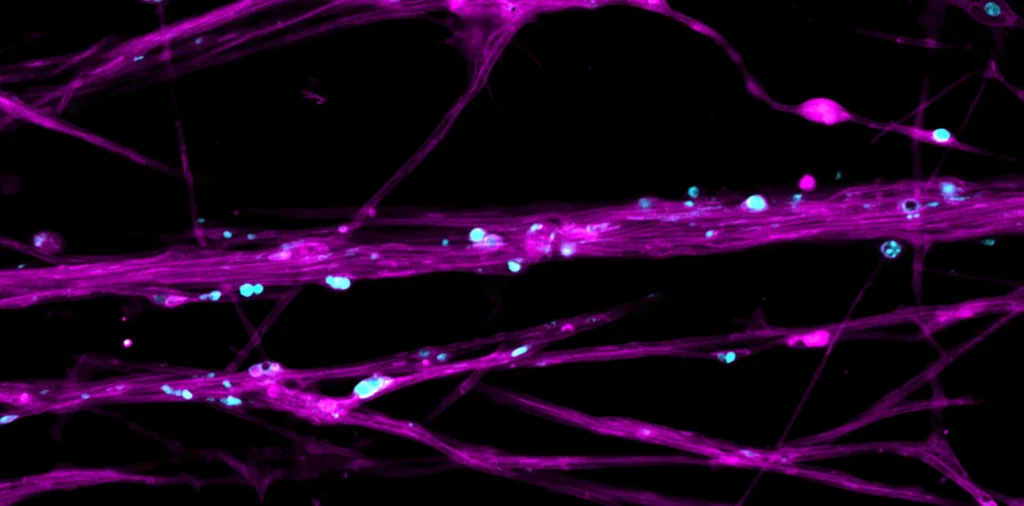
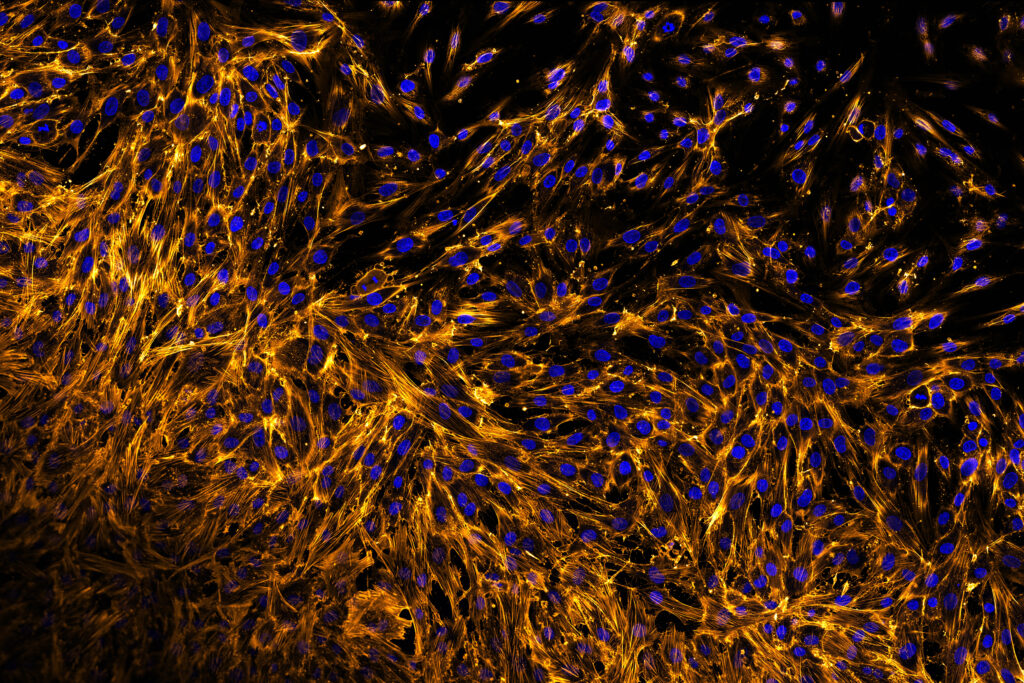
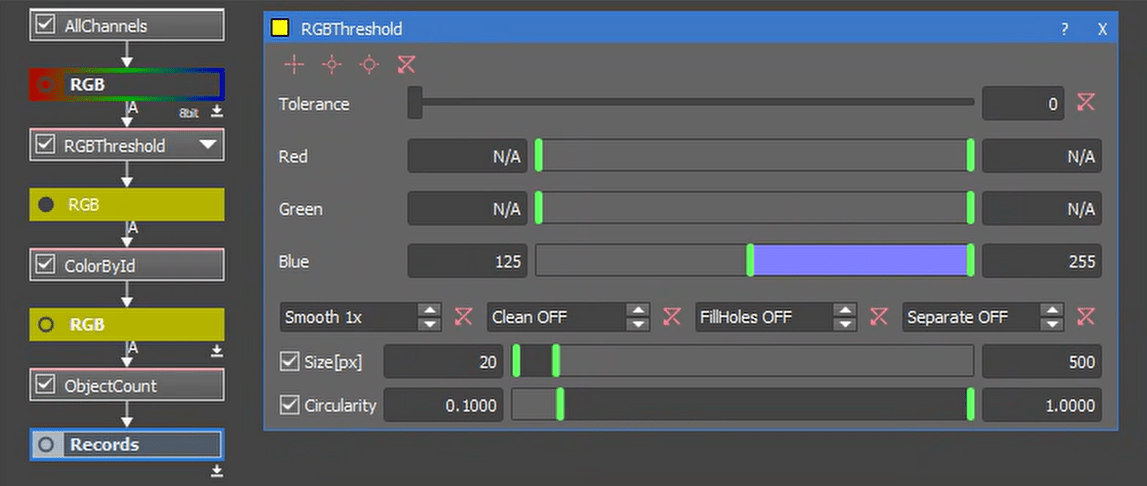
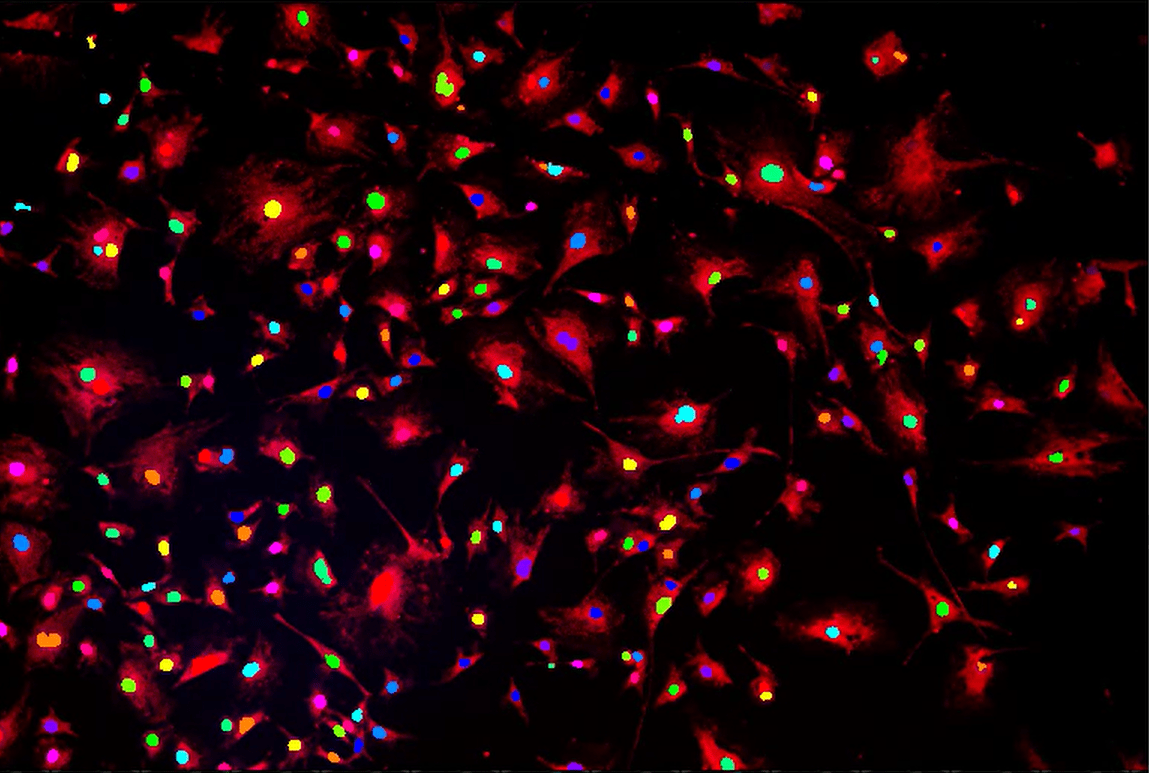
| This is easiest if you have a stain that just highlights nuclei. Use RGB Threshold first and play with the parameters until it looks like a reasonable estimate. Afterwards, I recommend using a Color by ID node to see where objects are separated and adjusting if necessary. Using Object Count from the Measurement tab will display the number of objects in the binary layer, which should be a good estimate for the number of cells. |
   |
| 3) Is it possible to segment in 3D? |
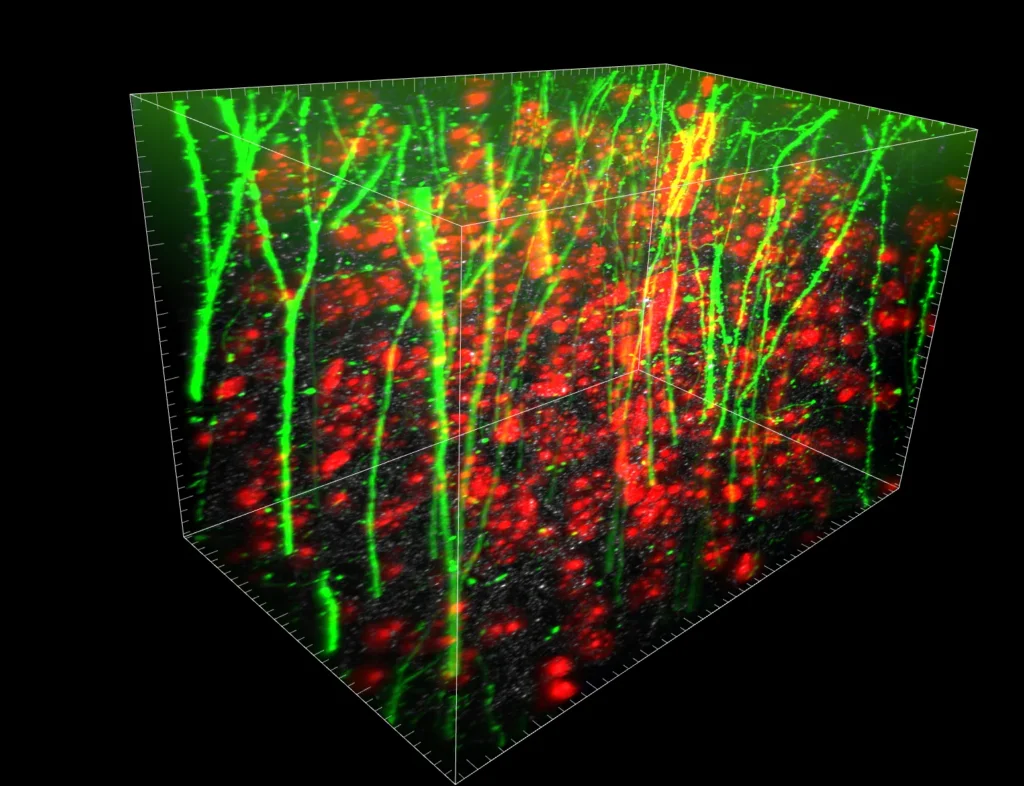
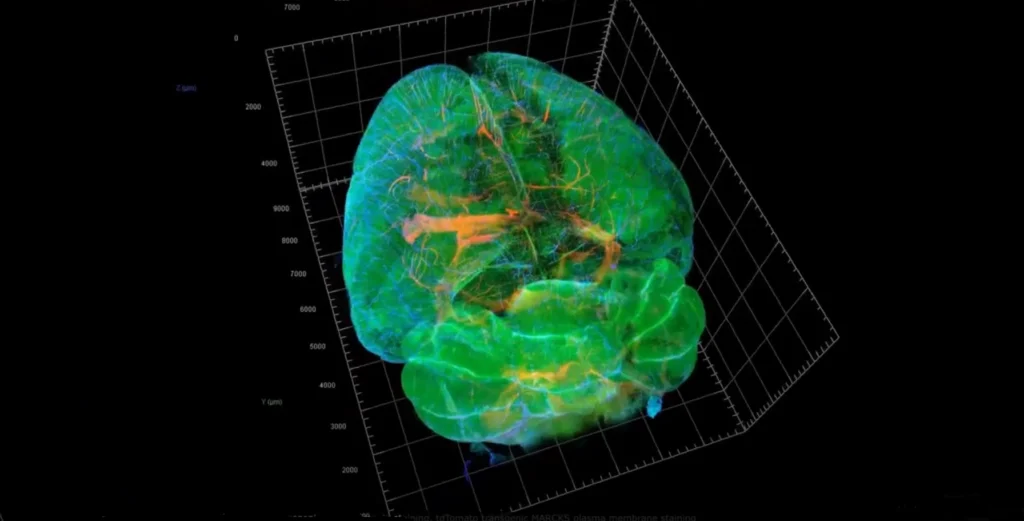
| Sure! There are multiple segmenting options for 3D analysis in the 3D segmentation tab. Threshold is the most complete and has multiple built-in post-processing options, Simple Threshold is very fast and has a single slider to adjust, and Bright Spots/Dark Spots are good for detecting nuclei or other small, round objects of interest. |
| 4) How can I measure the intensity of an object over time? |
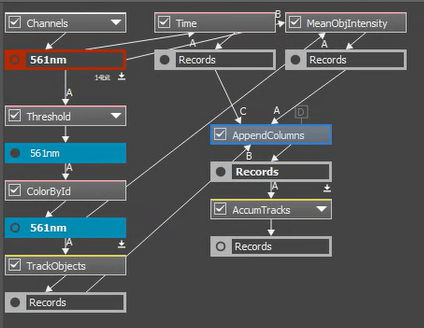
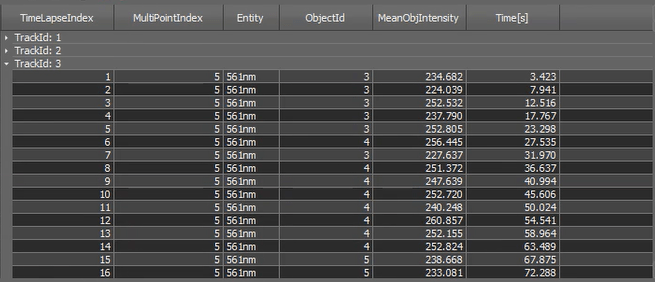
| This GA3 recipe will show the mean intensity of objects and the time of each frame. A list of mean intensity for each frame will be generated for each tracked object. If a different measurement is needed, you can replace the Mean Intensity node with another object intensity measurement node to measure maximum, median, standard deviation, etc. If you are interested in a single object over time, clicking on it in the image will highlight the object in the table so you can determine its track ID. Clicking on a Track ID in the table will highlight the corresponding object in the image. |
  |
| 5) Can I track the movement of something? |
| NIS Elements has an entire tab dedicated to this, Tracking. Object Position nodes will display the frame time and coordinates of binary objects and using Track Objects/Track Particles will track things. between frames. Connecting Accumulate Tracks to a tracking node and choosing the time loop will show tracked features over time. The Track Features node will track many useful movement values if connected to a table with time and position data. |
