| Object Count | Generates an object count from a binary layer as a table. |
| Total Pixel Count | Takes a binary layer and outputs the number of {1} pixels in a table. |
| Total Object Area | Outputs the area of {1} pixels in a binary layer in a table. Will be in square microns if image has the proper metadata. |
| Area Fraction | Displays the ratio of {1} to {0} in a binary layer using a table. |
| Measured Area | Displays the total number of pixels in a binary layer as a table, information that can also be found by looking at ROI Statistics for the whole image. |
| Perimeter | Calculates total object perimeter from a binary layer and displays it in a table. Encountered a bug the first time and got perimeter 304.132 for a binary layer with area ~3×106 px… when used later the result was more reasonable. |
| Mean Chord | Calculates the mean of binary objects’ secants in particular directions and displays it in a table. |
| SurfVolumeRatio | Uses perimeter and area to estimate surface-volume ratio of objects in a binary layer and displays it in a table. |
| Mean Intensity | Takes a color layer and a binary layer and calculates the mean intensity of the portion of the color layer under the binary layer. |
| Min Intensity | Same as Mean Intensity but for the minimum intensity covered by the binary layer. |
| Max Intensity | Same as Mean Intensity but for the maximum intensity covered by the binary layer. |
| Var Intensity | Calculates the variance of color pixel intensity covered by the input binary layer. |
| StDev Intensity | Calculates standard deviation of color pixel intensity covered by the binary layer. |
| Sum Intensity | Calculates the sum of color layer intensity for pixels covered by the binary layer. |
| Quantile | Determines the selected quantile for pixel intensities under the binary layer. 0.5 is median. Useful for quantifying data. |
| Pixel Values | Makes a table of the intensity value of each pixel under the binary image (got a table on the order of 106 entries for a 6000 x 3984 image). |
| SNR Estimate | Uses one of several methods to choose from to calculate signal-to-noise ratio of an RGB image (no binary input). |
| Focus Criterion | Uses a color image to calculate auto focus values for one of several possible image types. |
| Background Estimate | Uses a color image to calculate an estimate for background intensity. Could be useful for finding best values for thresholding. |
| Otsu Threshold | Uses a color layer and a binary layer to determine the threshold used in Otsu’s method. |
| Sigma Threshold | Uses a color and a binary layer to calculate parameters of a Gaussian distribution for intensity under the binary layer. Displays mean, sigma, and R2 values. |
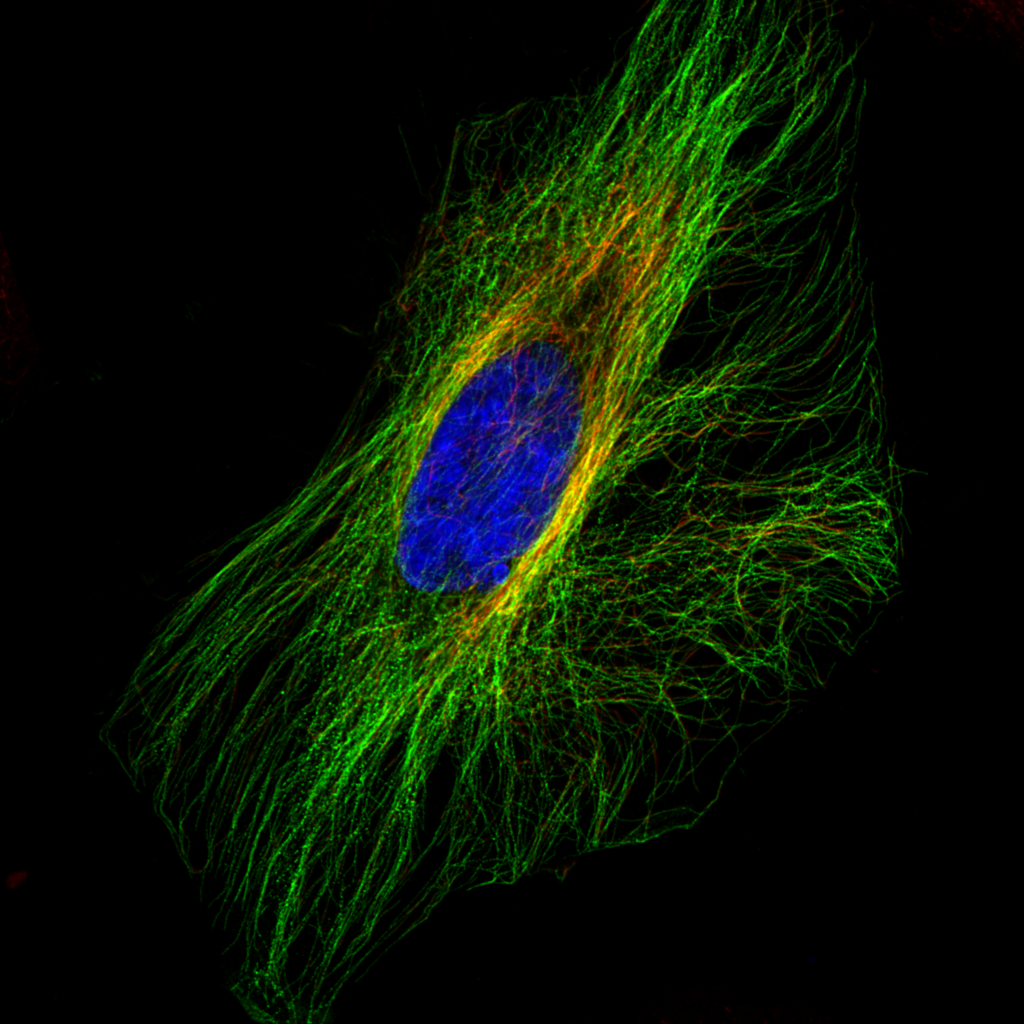
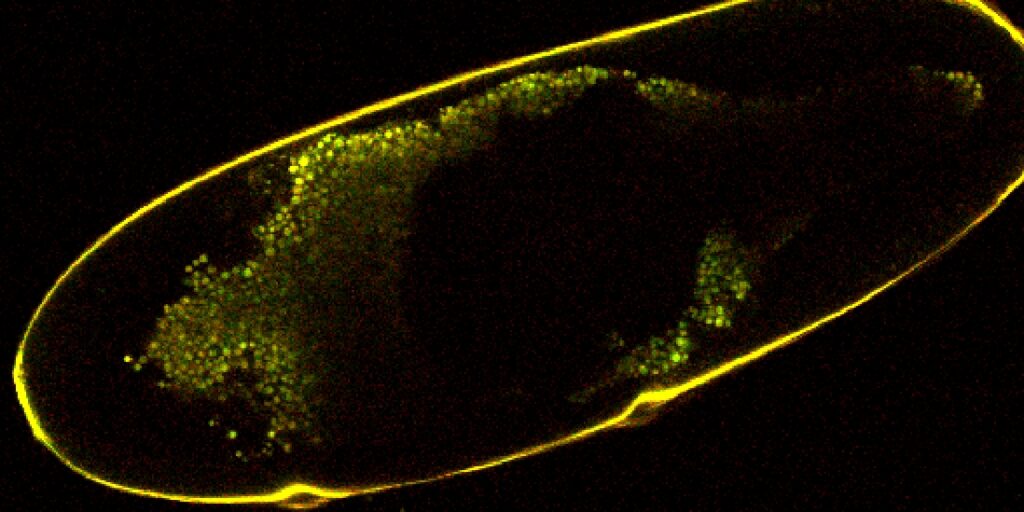
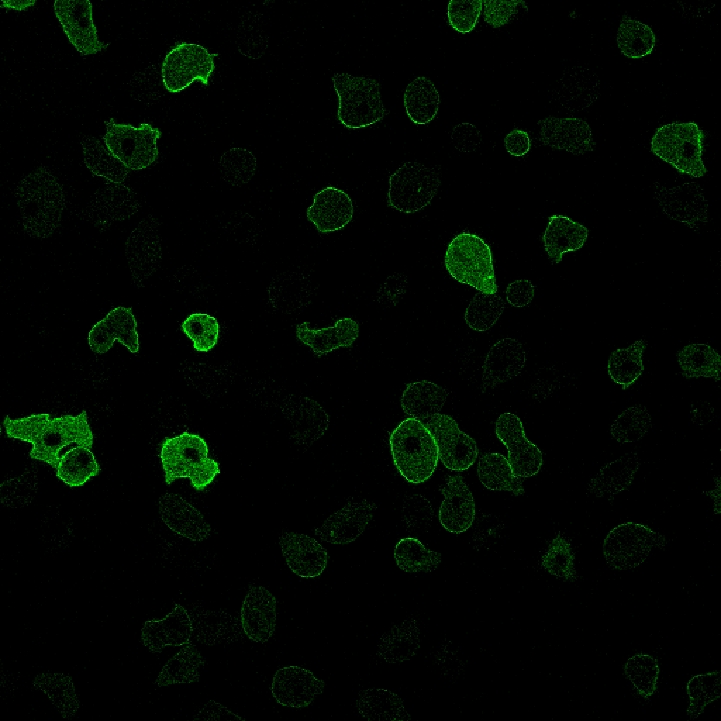
| Time | Displays acquisition time of a color layer. Example fluorescent image, being a merge, did not have this metadata, but its individual components did. |
| Bit Depth | Displays bitdepth of a color image. 8 for 8-bit, 16 for 16-bit, and 32 for float. |
| Calibration | Displays calibration (microns per pixel) of a color layer. Merged image did not have this metadata, but its components did. |
| Filename | Displays the associated file name of a color layer. |
| Channel Name | Displays the name (RGB, Blue, etc.) of the input channel, which can be seen in GA3 anyway. |
| Channel Metadata | Displays associated metadata of a color image, such as excitation and emission wavelengths of each channel, modality, and magnification. |
| Frame Center | Displays x and y coordinates of the center of a color layer. Supposed to be in microns, but output will be in pixels if the image does not have that metadata. |
| Frame Center Pixels | Displays x and y coordinates of the center of a color layer in pixels. |
| Frame Size | Displays length and width of a color layer, in microns if image has metadata, or in pixels if it does not. |
| Frame Size Pixels | Displays length and width of a color layer in pixels. |
| Max Allowed Value | Displays maximum possible intensity of a color layer. 255 for 8-bit, 65535 for 16-bit, floating point limit (~3.403 x 1038) for float. |
| Min Allowed Value | Displays minimum possible intensity of a color layer. 0 for 8-bit and 16-bit, negative floating point limit for float. |
| Recorded Data | Shows color layer’s metadata. Can select what to view using menu. Lots of options to choose from but metadata may not exist for some images. |
| All Recorded Data | Shows all metadata that was recorded for a color layer. |
| Stage Position | Shows stage position metadata of a color layer if it exists. |
| Z Step | Shows step size for each slice in a z stack. |
| Eq Diameter | Creates a table containing the diameter in pixels of circles with the same area as each object in a binary layer. |
| Fill Area | Creates a table showing the pixel area of each object in a binary layer. |
| Length | Calculates the length of each object in a binary layer using the perimeter and area. Designed for long, thin features. |
| Line Length | Calculates the length of objects in a binary layer. Designed for oblong shapes. |
| Max Feret | Calculates the maximum Feret diameter for each object in a binary layer. Essentially a caliper measurement (object is bounded by 2 parallel lines). |
| Max Feret 90 | Calculates the length of each object parallel to the maximum Feret diameter (perpendicular to a caliper measurement). |
| Min Feret | Calculates the minimum Feret diameter for each object. |
| Object Pixel Count | Displays the number of pixels of each object in a binary layer. Same data as Fill Area. |
| Object Area | Displays the area of each object in a binary layer in pixels. Same data as Fill Area and Object Pixel Count. May display area in square microns if image has appropriate metadata. |
| Outer Perimeter | Calculates the perimeter of each object in a binary layer, not including internal holes. |
| Perimeter | Calculates the perimeter of each object in a binary layer. Includes internal holes. |
| Perimeter Contour | Another algorithm for calculating object perimeters. Higher quality but more time-consuming. |
| Volume Eq Cylinder | Calculates the volume of cylinders constructed using the maximum and minimum Feret diameters, as well as width and height. |
| Volume Eq Sphere | Calculates the volume of spheres with diameter found from Eq Diameter of each binary object. |
| Width | Calculates the width of each binary object by dividing Length by Area. Best for long, thin features. |
| Circularity | Calculates a circularity parameter for each binary object using area and perimeter. Circles are 1. |
| Convexity | Calculates a convexity parameter for each binary object. |
| Elongation | Calculates an elongation parameter for each binary object by dividing Max Feret Diameter by Min Feret Diameter. |
| Fill Ratio | Determines how much of area bounded by binary objects’ perimeter is filled. 1 for objects without holes, less for objects with holes. |
| Mean Chord | Takes the mean of binary objects’ secants in 4 directions. |
| Orientation | Displays the orientation (horizontal is 0) of the Max Feret Diameter for each binary object. |
| Roughness | Calculates a roughness parameter for each object (circular is 1, less is rougher). |
| Roughness Inf | 1/roughness. 1 is still circular. |
| Shape Factor | Another method of defining binary objects’ roughness. |
| Mean Obj Intensity | Using a binary and a color layer, calculates the mean intensity value under each binary object. Intensity is defined as the sum of R, G, and B channel values divided by 3. |
| Min Obj Intensity | Using a binary and a color layer, calculates the minimum intensity value under each binary object. |
| Max Obj Intensity | Using a binary and a color layer, calculates the maximum intensity value under each binary object. |
| Var Obj Intensity | Using a binary and a color layer, calculates the variance of intensity values under each binary object. |
| StDev Obj Intensity | Using a binary and a color layer, calculates the standard deviation of intensity values under each binary object. |
| Sum Obj Intensity | Using a binary and a color layer, calculates the sum of intensity values under each binary object. |
| Obj Quantile | Using a binary and a color layer, calculates the selected quantile of intensity under each binary object. 0.5 is median. |
| Obj Pixel Values | Using a binary and a color layer, displays object ID, X and Y coordinates, and intensity for each pixel included in the binary layer. |
| Obj Profile Line | Like Obj Pixel Values but groups pixels along lines. Can be used to make charts of intensity cross-sections. |
| Ratio | Using a binary layer and 2 color inputs, calculates the ratio between colored pixels covered by each binary object. May be useful for finding ratio between differently marked proteins, what percentage of area the nucleus is, etc. |
| Pearson Coeff | Calculates a Pearson correlation coefficient under each binary object for 2 color channels. It is a measure of linear correlation that ranges from -1 (negative linear) to 1 (positive linear). 0 implies no linear correlation. |
| Manders Coeff | Calculates Manders overlap, Manders overlap coefficient, and Manders colocalization coefficient values, which quantify how close areas of fluorescence are to each other. Should be used after thoroughly denoising the image and subtracting the background. MOC (Manders overlap) is from 0 to 1. K1 and K2 are the Manders overlap coefficients, where (MOC)2 = (K1)(K2). M1 and M2 are the colocalization coefficients, from 0 to 1. M1 is the fraction of input B in areas of input C, and M2 is the fraction of input C in areas of input B. |
| Aggregate Children | Takes 2 or more binary layers and classifies the second as children of objects in the first. Can choose to define “children” as objects inside the parent layer, objects intersecting the parent layer, or classify parents as the closest object in the layer. Displays the number of children of each object in the parent layer. |
| Children | Same options as Aggregate Children, but displays the distance between parents and children defined in the way of choice (center to center, center to border, border to border, etc.) Could not get the table to display data properly. |
| Child ID | Same options as Aggregate Children. Displays a table of parent object IDs and corresponding child object IDs. |
| Child Distance | Displays a table of distance to parent for each child object. Same options to define parents/children and distance as Children. |
| Nearest Child | Displays a table that gives the object ID of the closest child object to each parent object. Same options to define parents/children and distance as Children. |
| Object ID | Displays a table of each object in a binary layer and its ID. As is the case with all tables of objects, if you click on a row Elements causes the corresponding object to flash. |
| Parent ID | Displays a table listing each child object with its parent object ID. Only has options for defining criteria for parents/children. |
| Parent Distance | Displays a table listing each child object with its parent object’s ID and distance defined in one of several ways. Same options to define parents/children and distance as Children. |
| Detection Accuracy | Using a binary input for ground truth and another binary input for prediction, creates a table listing number of true positives, false positives, precision (TP/all positives), recall (TP/all things that should have been positives), and F1 (2 x precision x recall / (precision + recall)). A table version of Detection Classifier. |
| Center | Displays the object ID and X/Y coordinates of each object’s center in a binary layer. Would probably give values in microns if image has appropriate metadata. |
| CenterPx | Displays the object ID and X/Y coordinates of each binary object’s center in pixels. |
| CenterAbs | Displays object ID and X/Y distance from the center of the image. |
| Centroid | Takes a binary and a color input and displays the ID number and centroid coordinates of each binary object. Unlike Center which assumes uniform density of objects, Centroid is calculated taking density into account, so Centroid will be closer to more intense parts of objects compared to Center. |
| CentroidPx | Same as CenterPx but takes color input to account for density. |
| CentroidAbs | Same as CenterAbs but takes color input to account for density. |
| Start | For each binary object, displays ID number and X/Y coordinates of pixel closest to the top left corner (0,0). Would probably give units in microns if image has appropriate metadata. |
| StartPx | For each binary object, displays ID number and pixel X/Y coordinates of pixel closest to (0,0). |
| Bounds | For each binary object, displays ID number and distance from left, top, right, and bottom borders of image. Would be in microns if image has appropriate metadata. |
| Bounds Px | For each binary object, displays ID number and distance from left, top, right, and bottom in pixels. |
| Bounds Abs | For each binary object, displays ID number and distance from image center of each edge of rectangles that contain object. |
| NearestObjDistance | For each binary object, displays ID number and distance and ID of the nearest neighbor. |
| Distance | Using 2 binary layer inputs, displays IDs and distance between nearest neighbors of different layers. Can define distance as center to center, center to border, etc. |
| JS Measure Field | Opens a JavaScript dialog to code custom measurements of image. |
| JS Measure Objects | Opens a JavaScript dialog to code custom measurements of binary layer objects. |
