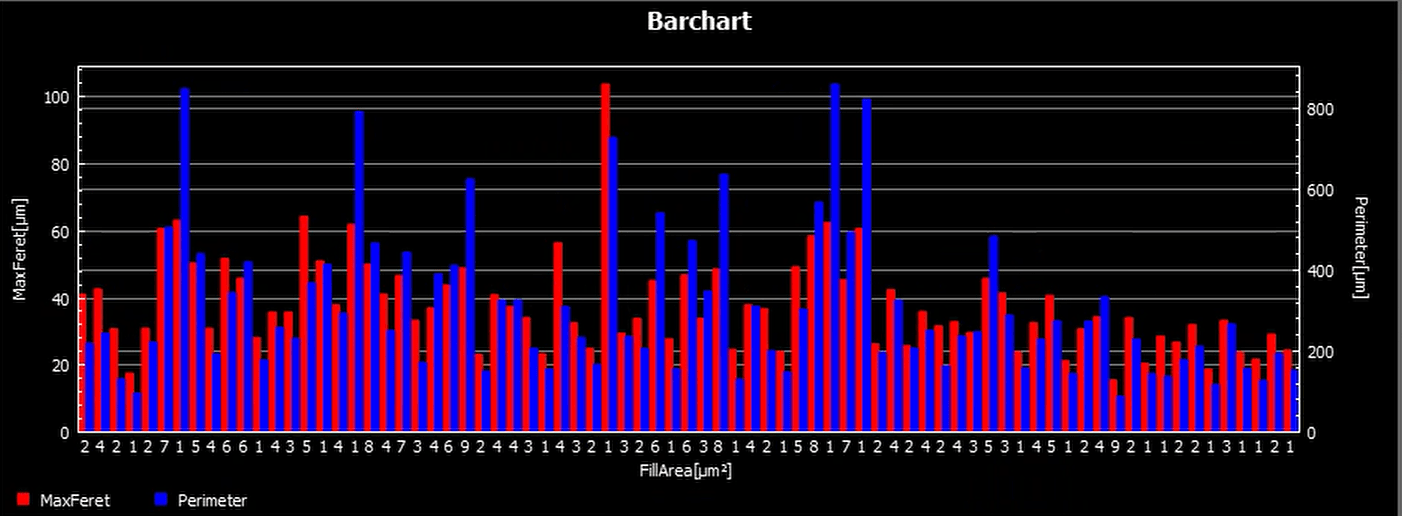
| Barchart | Generates a barchart from a table. Need to specify X and Y axes but can have both left and right Y axes. |
|  |
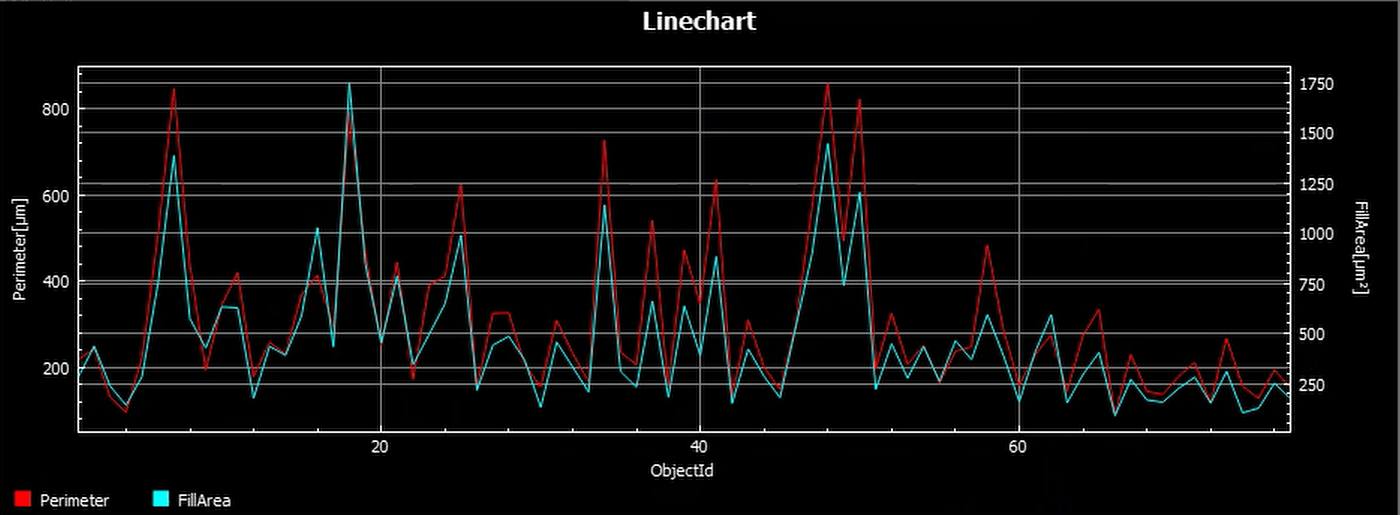
| Linechart | Generates a linechart from a table. Need to specify data for X and Y axes but can have both left and right Y axes. |
|  |
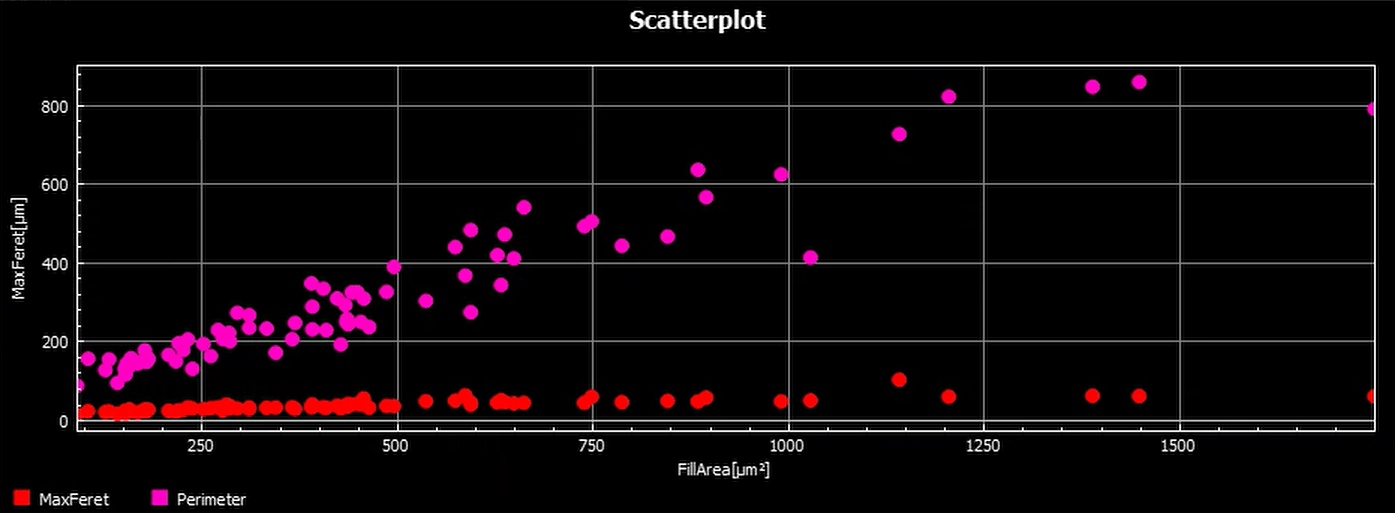
| Scatterplot | Generates a scatterplot from a table. Need to specify columns to use as X and Y axes and can have two Y axes. |
|  |
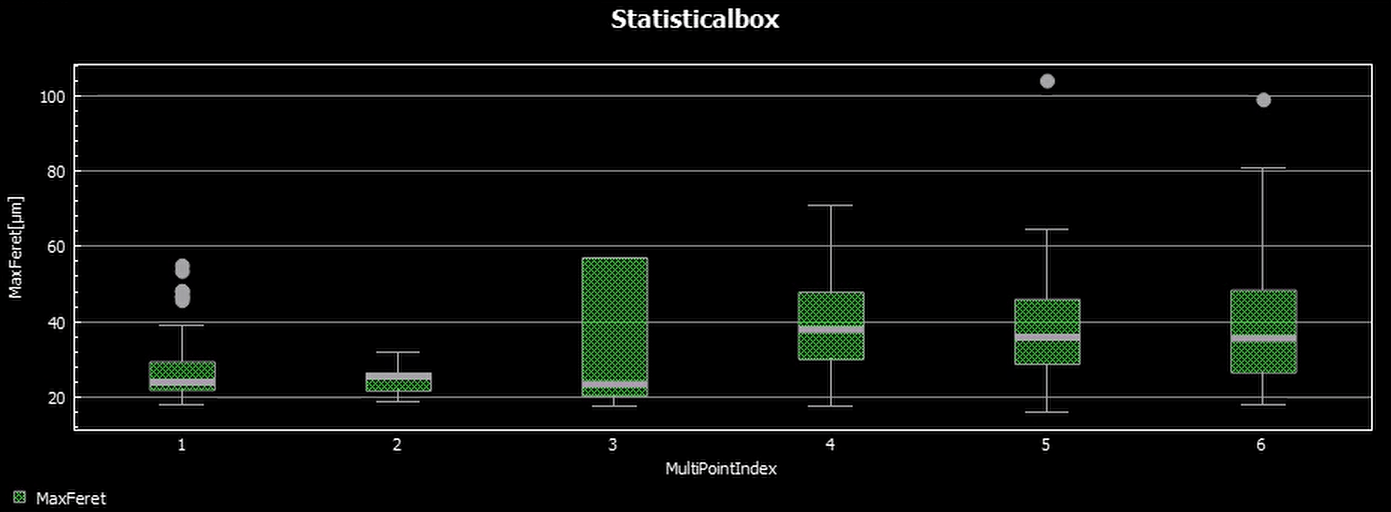
| Statistical Box | Generates a boxplot from a table. Need to specify data for X and Y axes and can only have one Y axis. |
|  |
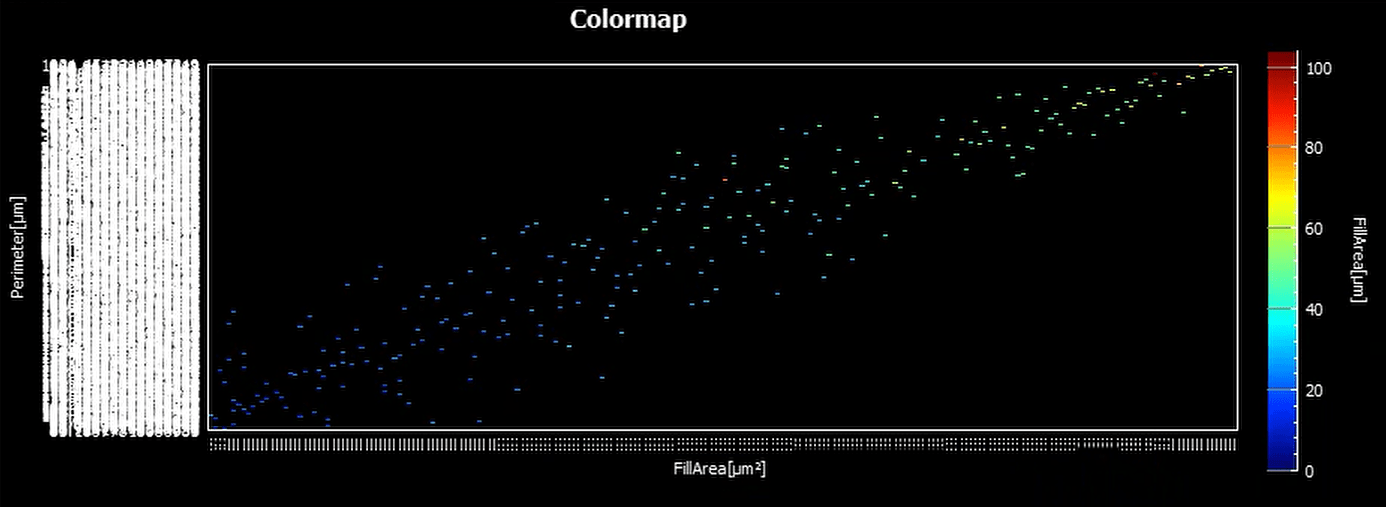
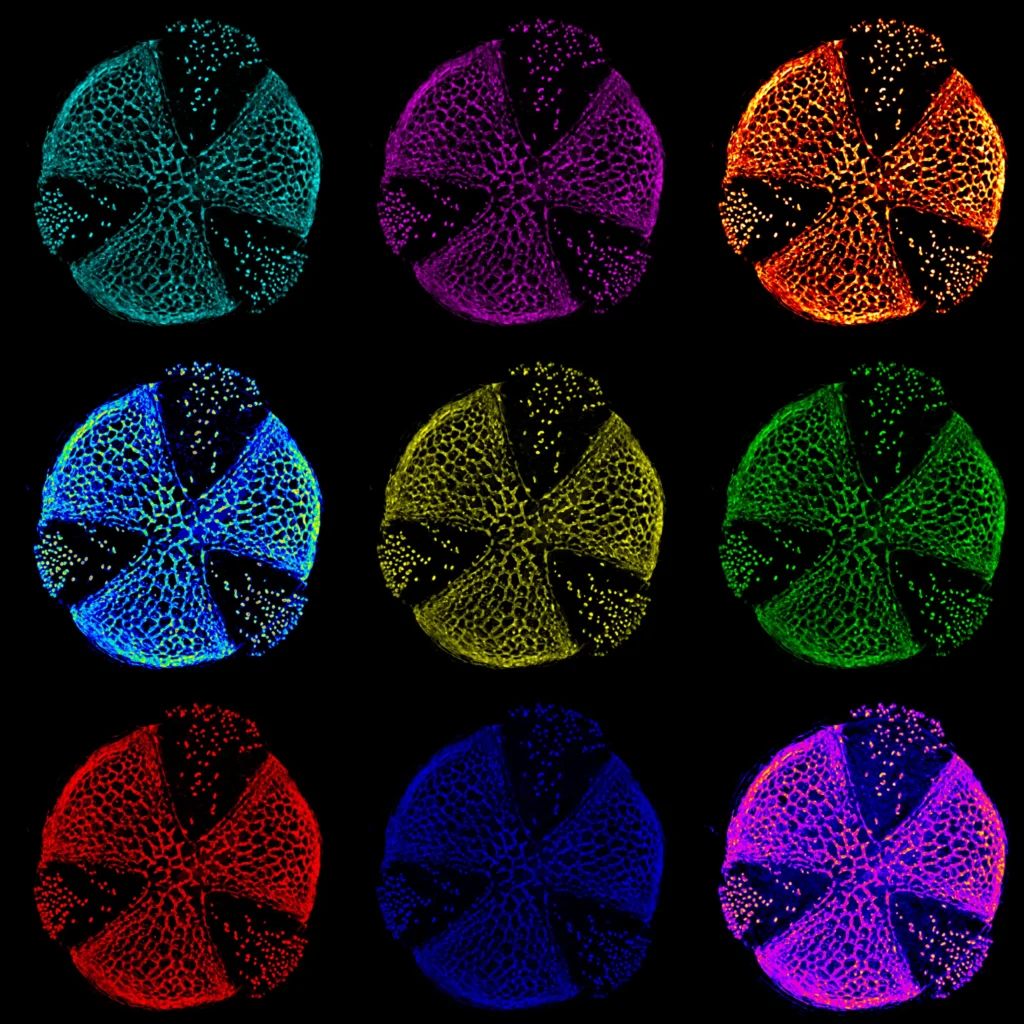
| Colormap | Given 3 data columns, generates a representation of a data set using X, Y, and a selected color scale. |
|  |
| Cumulative Results | Supposed to find a table from a database and add it to the end of the input table, could not get it to retrieve a table properly. Can also check boxes to include filename and run index to the output table, which will be the same as the input if a database table is not found. Node also includes options for how to deal with duplicated columns. |
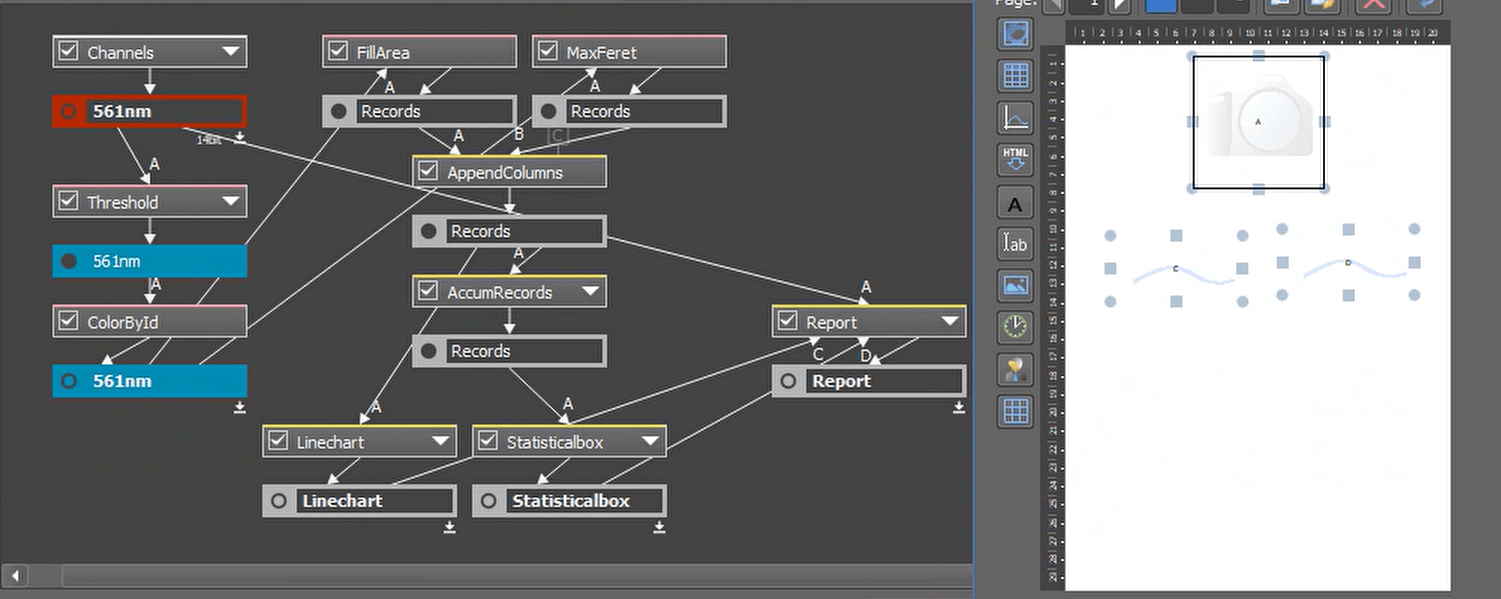
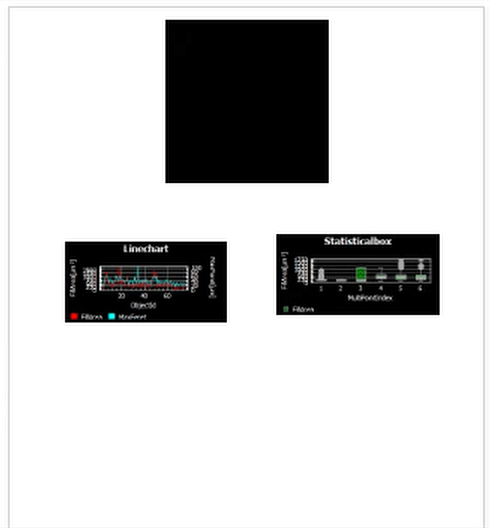
| Report | A node that designs a template for displaying images/tables/graphs. Starts out with no inputs, but as elements are added nodes can be connected to populate the template. |
 |  |
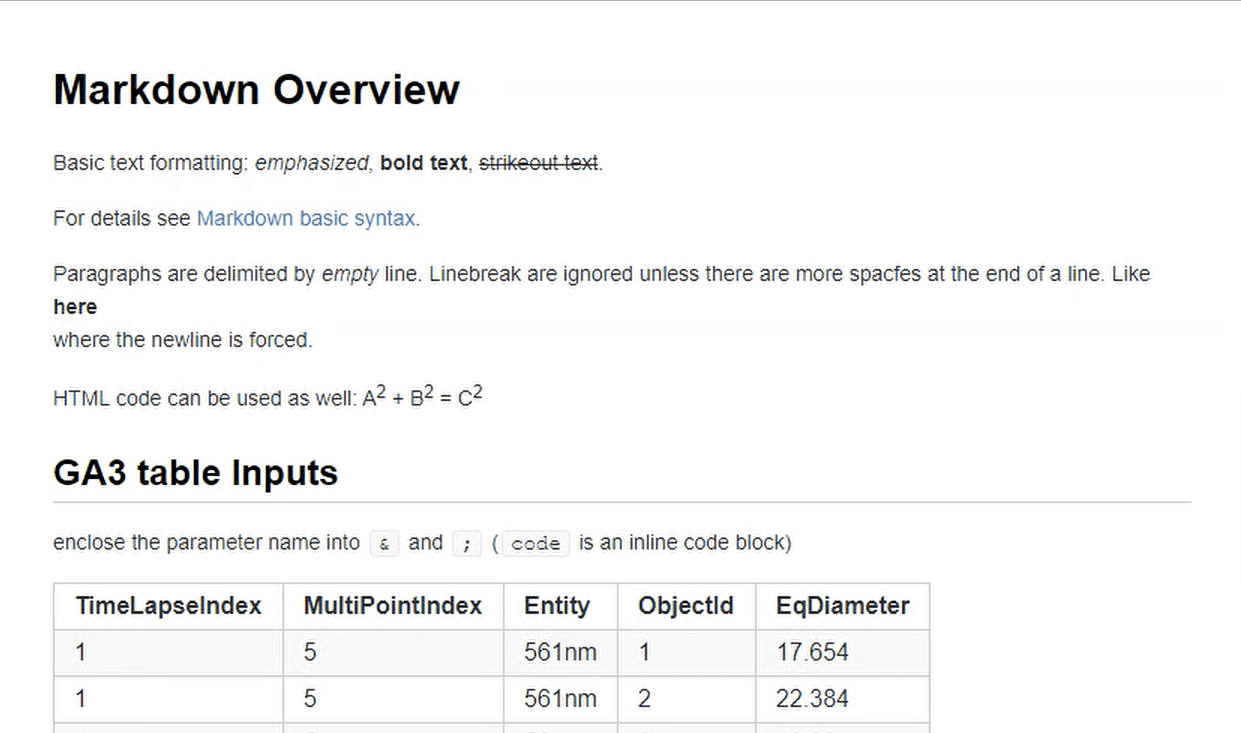
| Html Document | Opens a dialog that can be used to create a document that can be saved as a PDF and take table inputs that will be included. Has one section for the document content and another for how it is formatted. Comes with some example code by default.  |
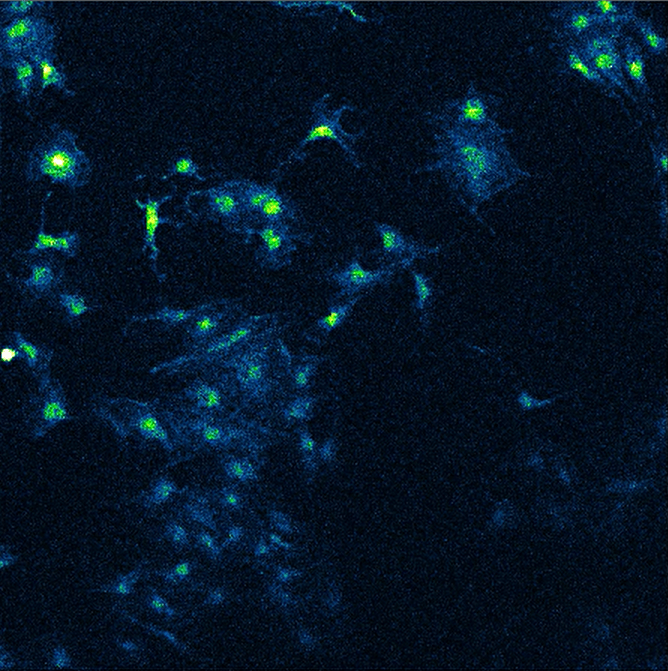
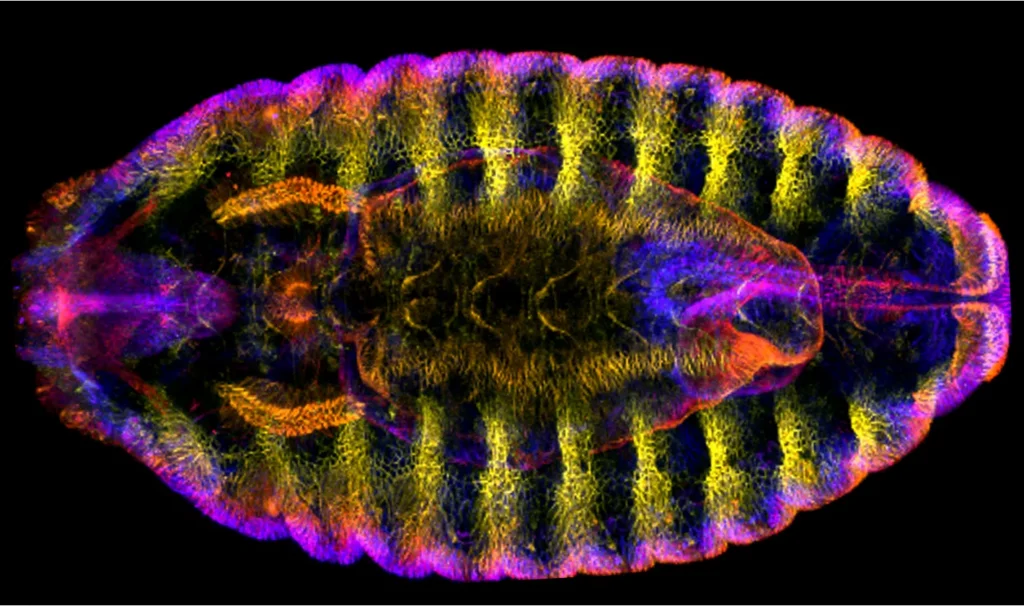
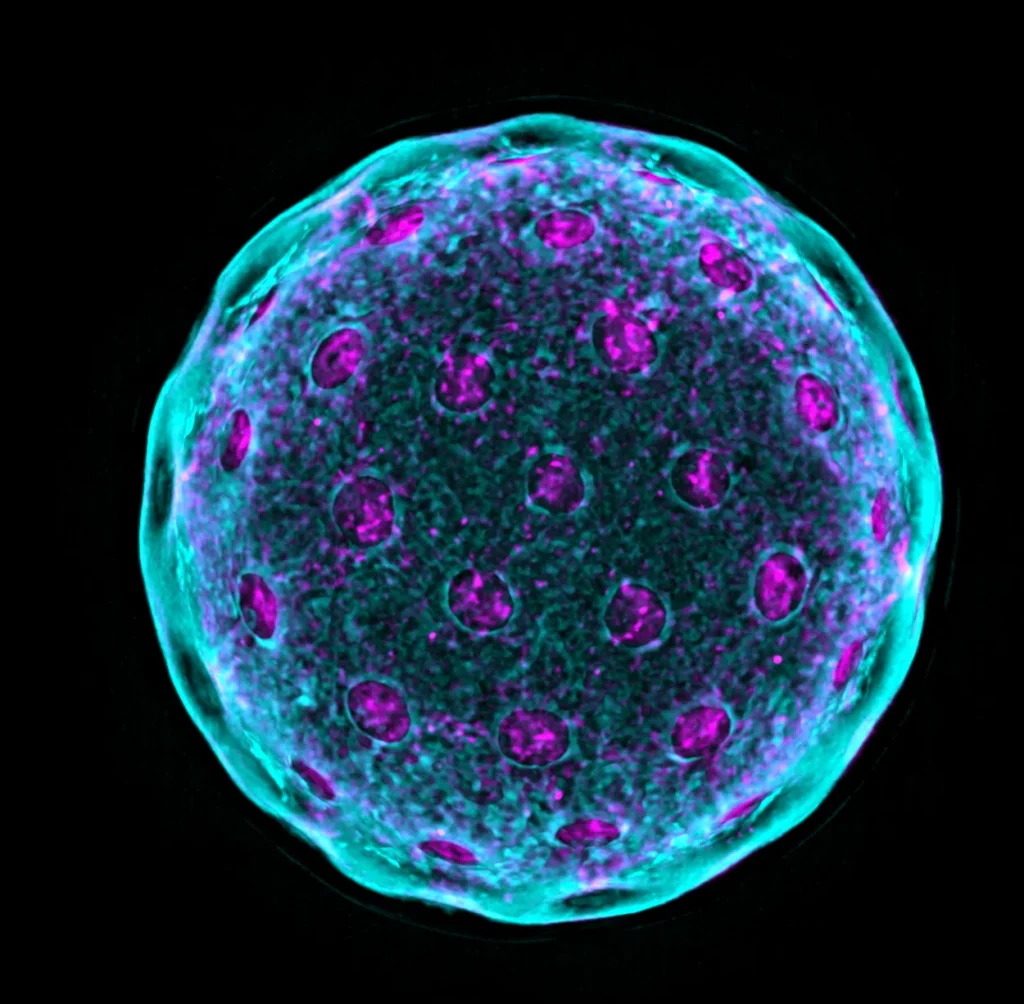
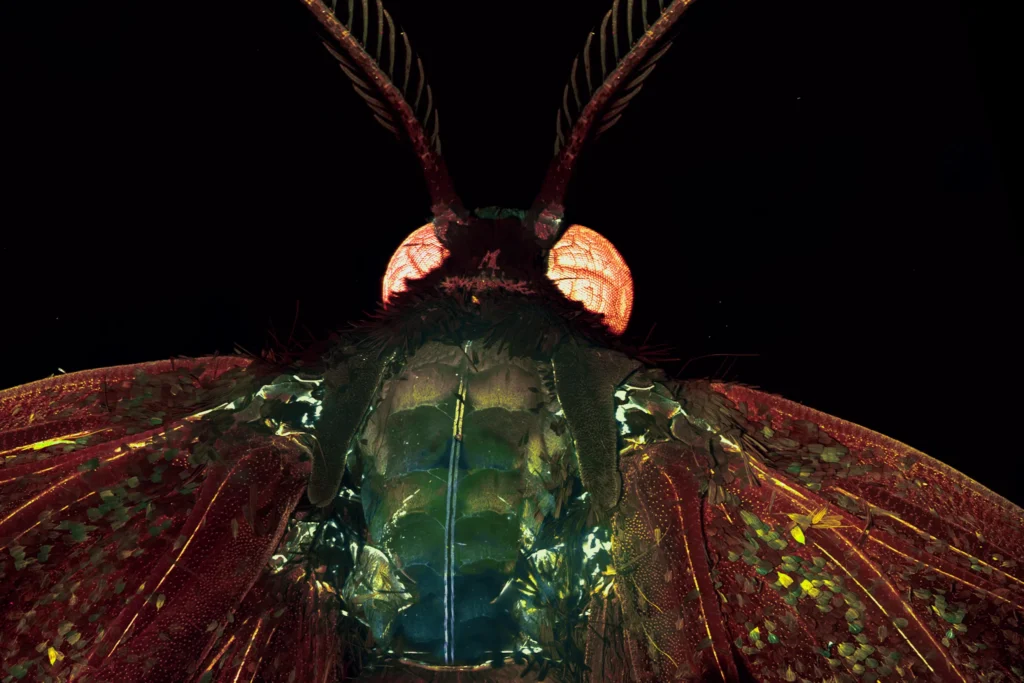
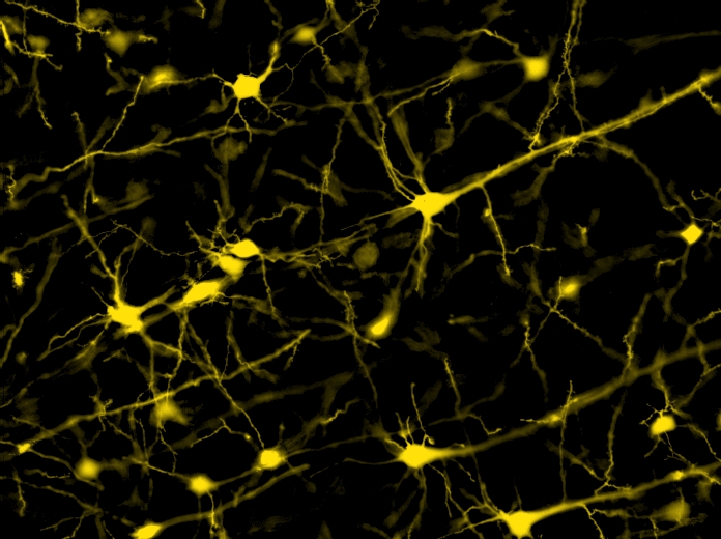
| Visible Channels | A tool for converting visible channels into images to present. Can change color scale from original to a psuedocolor scheme. Does not show up in GA3 preview, need to run analysis to see output.  |
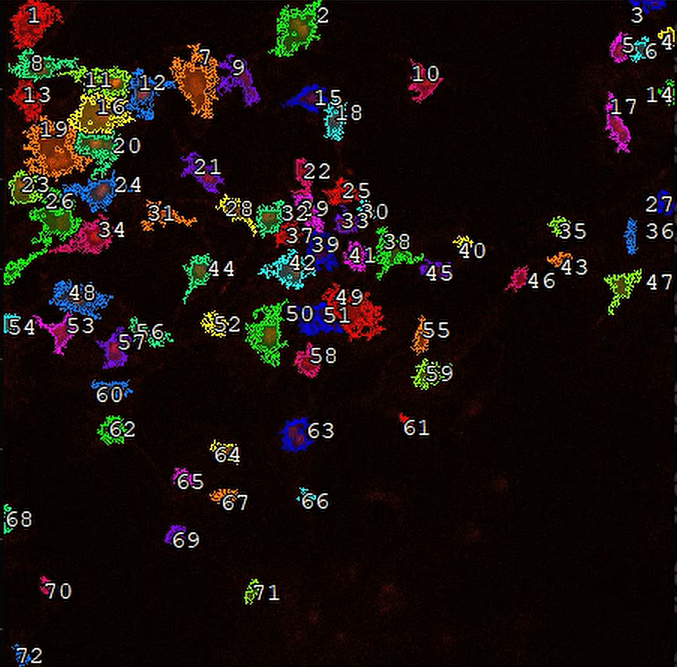
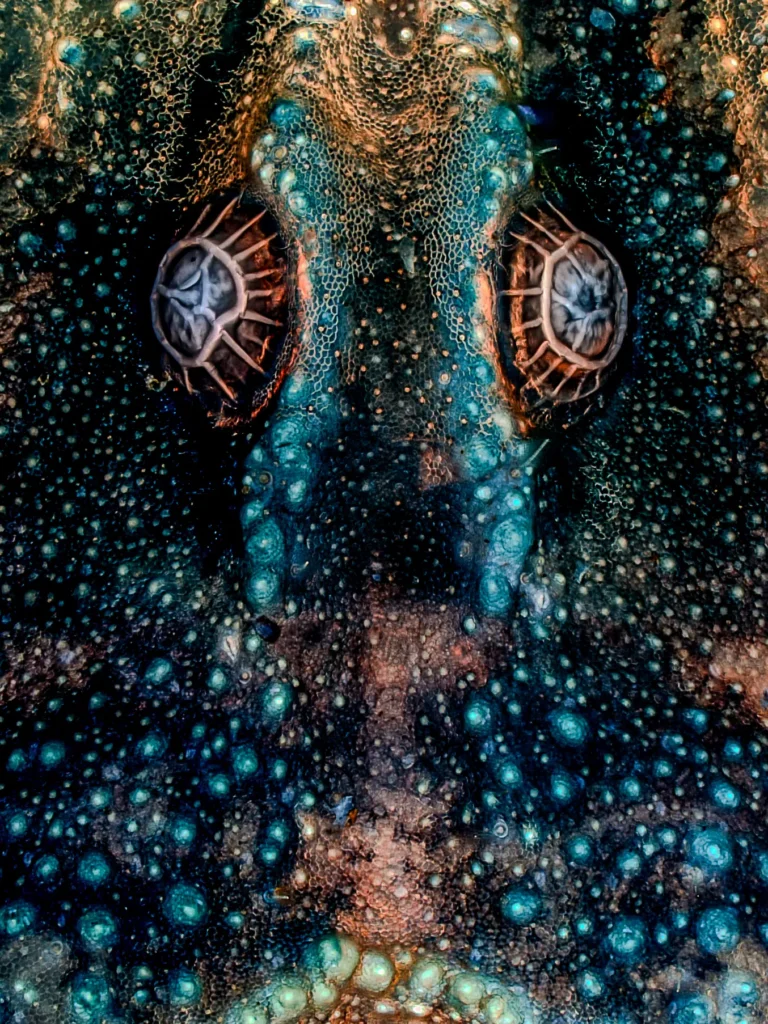
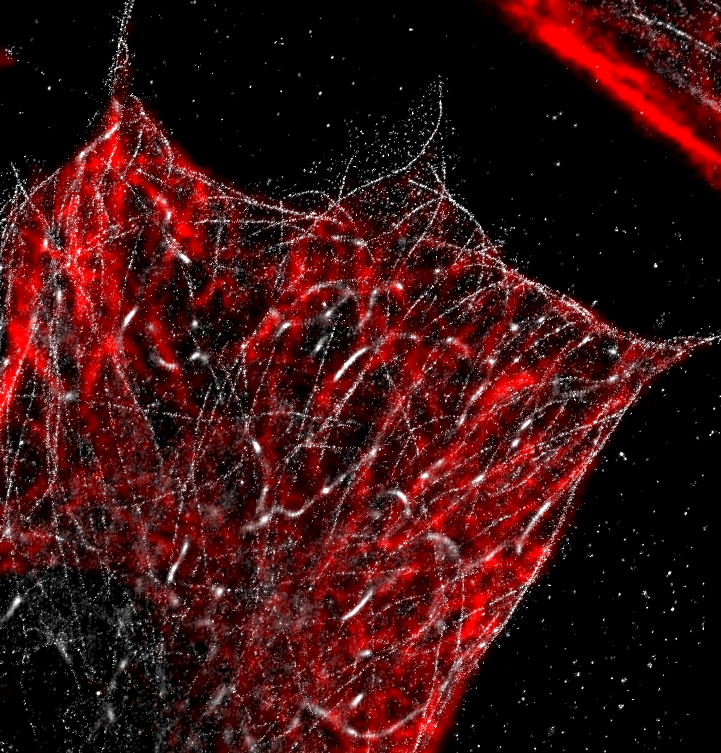
| Visible Binaries | A tool for converting binary overlays into images for presentation. Can choose to show object IDs and set binary transparency.  |
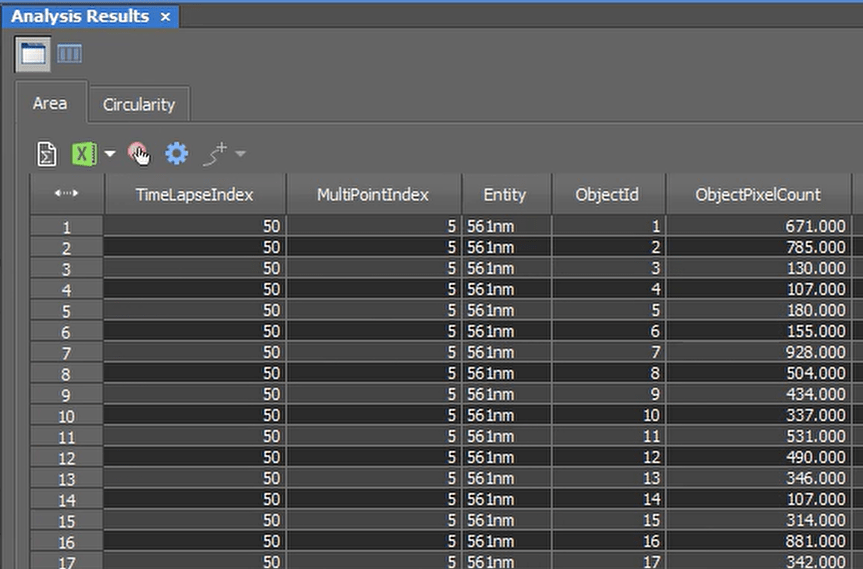
| Visible Tables | A tool for organizing tables for presentation. Does not display in preview, need to run analysis to see the output. Cannot adjust anything; the output just had a window with the input tables.  |