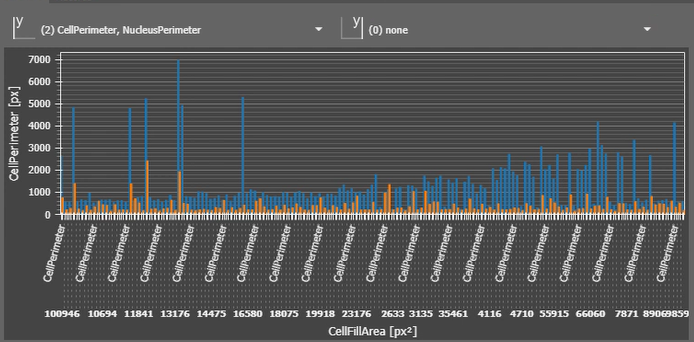
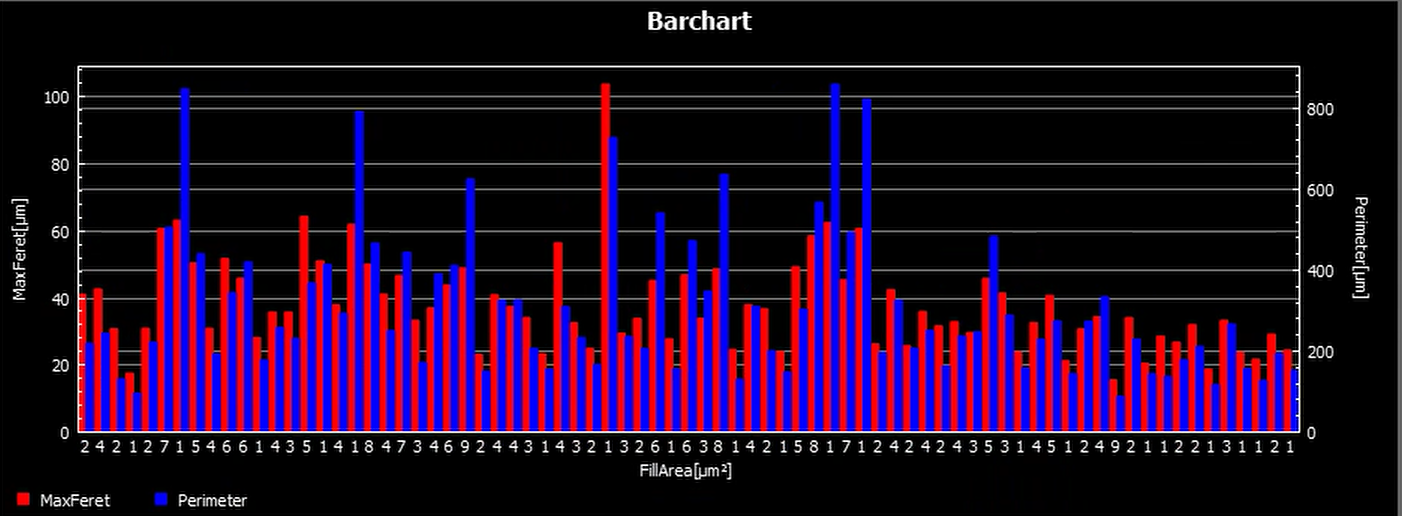
| Barchart (Graphs) | Generates a barchart from a table. Need to specify X and Y axes but can have both left and right Y axes. Can choose which series to view from the drop down menu. |
|  |
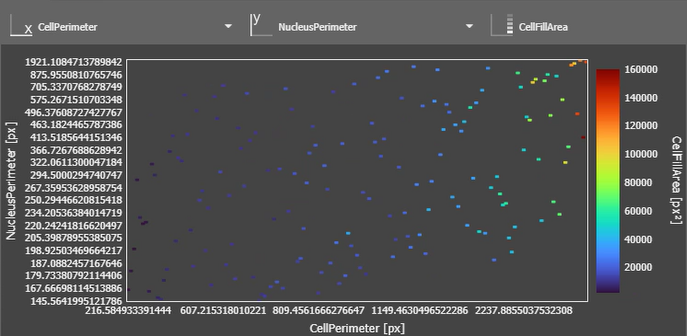
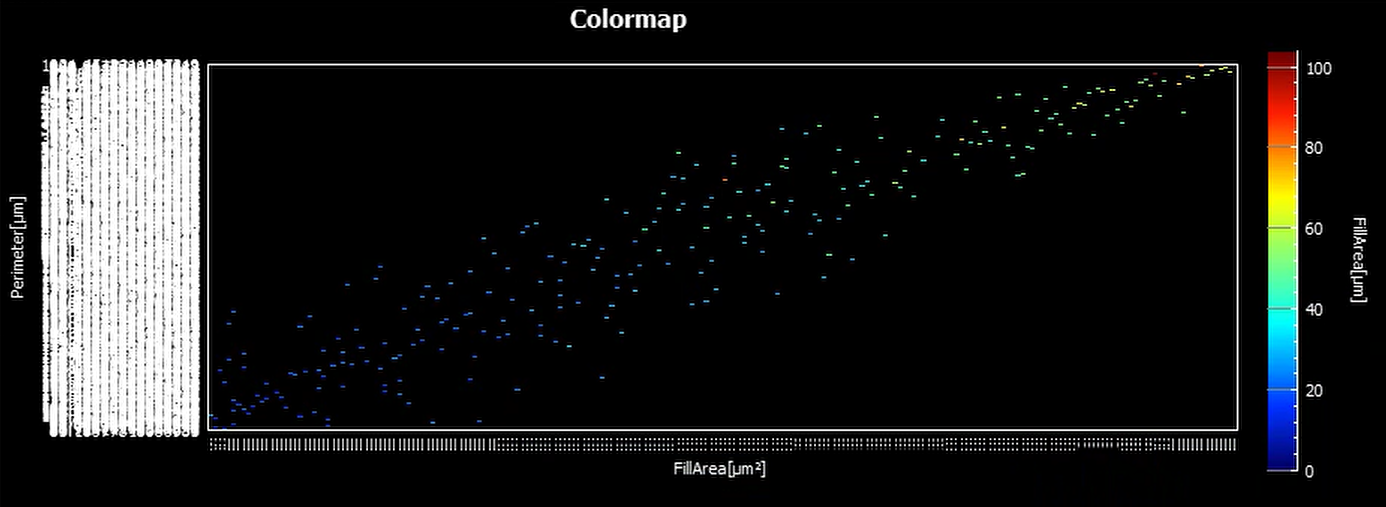
| Colormap (Graphs) | Generates a colormap from a table. Need to select X, Y, and color axes. Can take some time to update when parameters are changed, closing the options windows helps. |
|  |
| Fitplot (Graphs) | Supposed to plot data and an associated fitted equation. Could not choose any entries for the data and equation selection. |
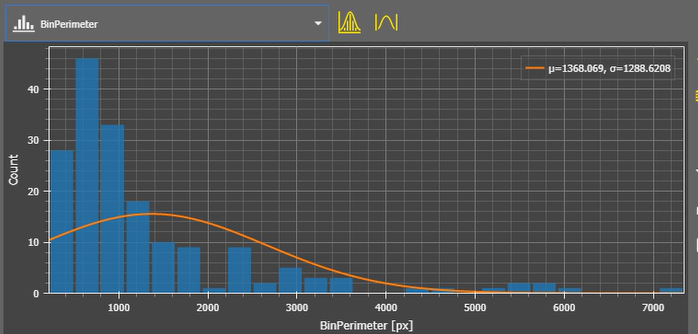
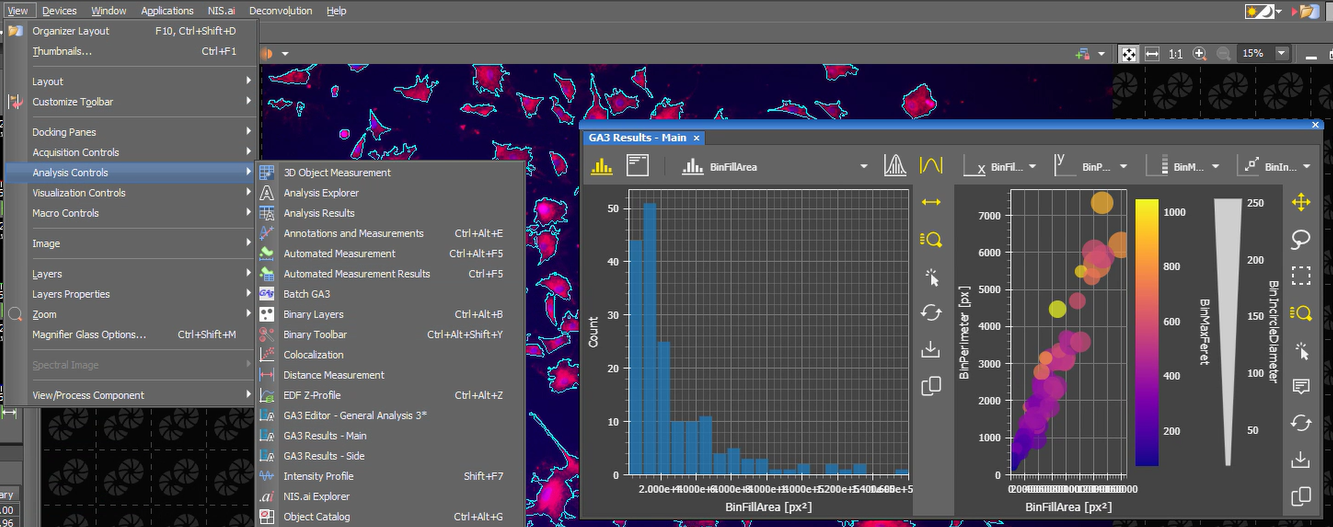
| Histogram (Graphs) | Generates a histogram from a table. Can select multiple columns to include, but only one can be displayed at a time. Can choose to include a fitted gaussian curve in the graph window, and the number of histogram bins in the options window. |
|  |
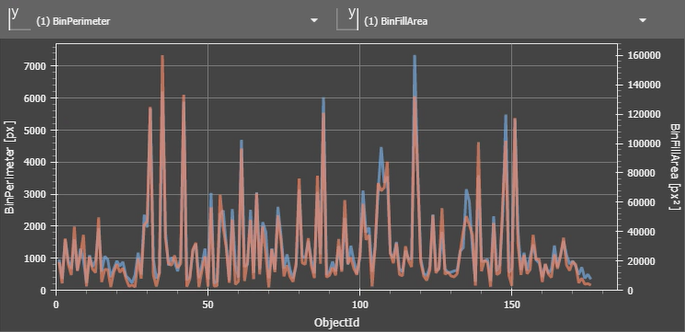
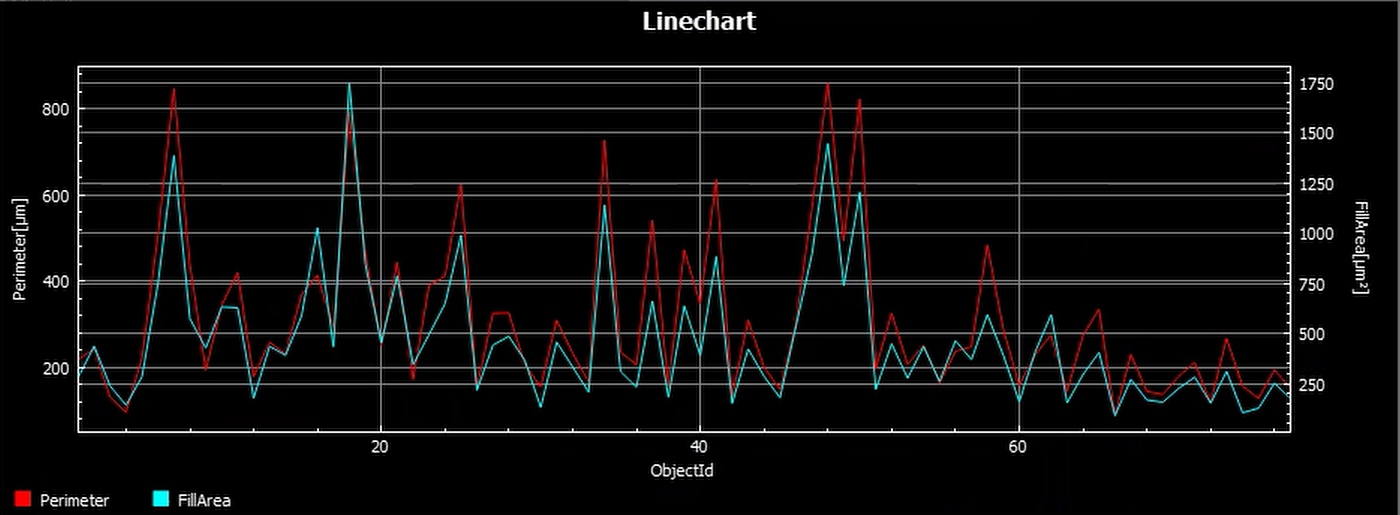
| Linechart (Graphs) | Generates a linechart from a table. Need to specify data for X and Y axes but can have both left and right Y axes. Can have multiple columns for each Y axis and choose which to view at the top of the graph window. |
|  |
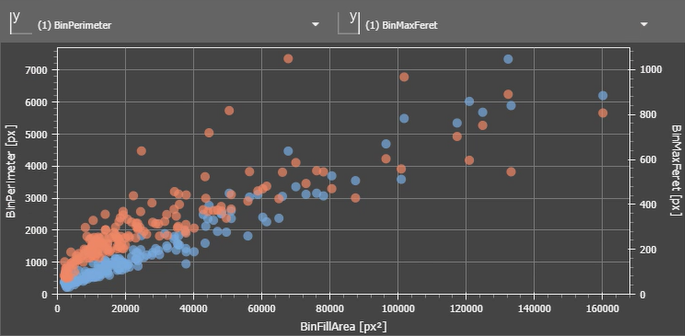
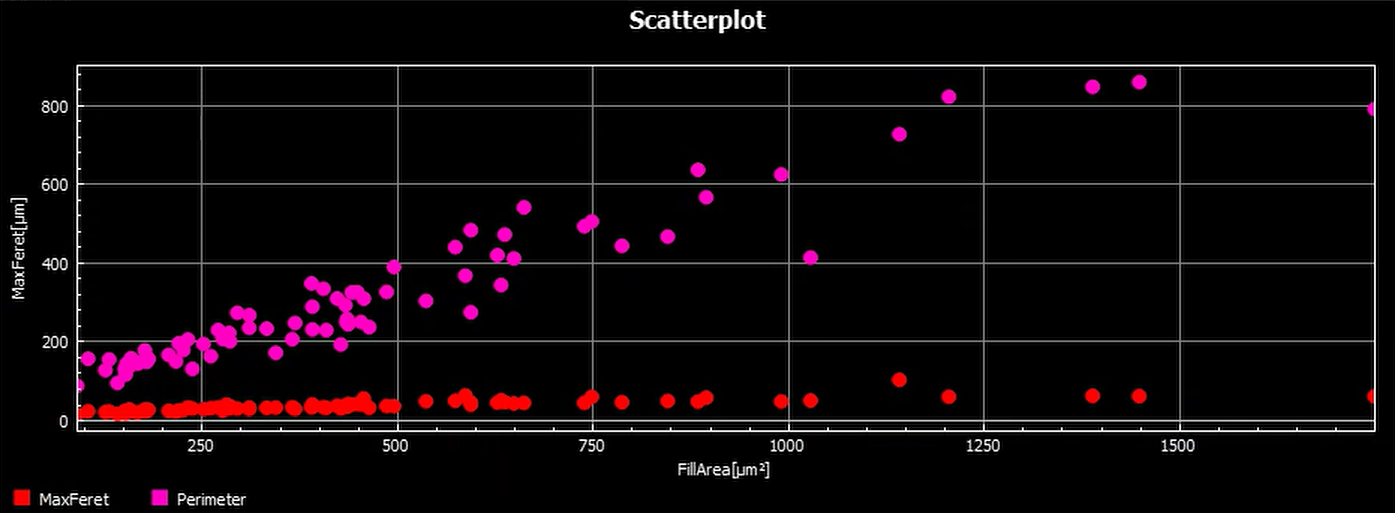
| Scatterplot (Graphs) | Generates a scatterplot from a table. Need to specify columns to use as X and Y axes and can have two Y axes. Can choose which series to view from the drop down menu. |
|  |
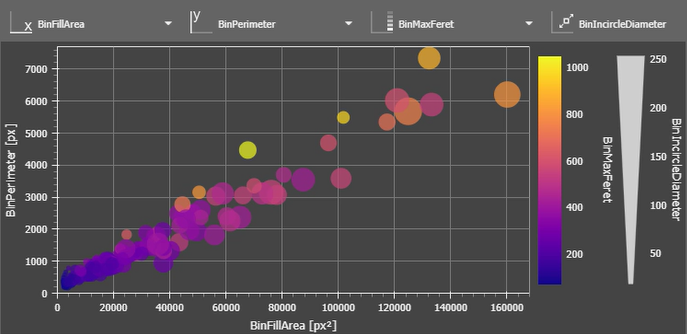
| Scatterplot 4D (Graphs) | Generates a scatterplot from a table that can also have color and dot size dimensions. Can choose which series to view from the drop down menu. |
|  |
| Display | When connected to layout notes, specifies where results are displayed after analysis is run. Need to go to GA3 Results-Main to pull up window. |
|  |
| Horizontal | When used with Display, organizes plots to be horizontally adjacent to each other. |
| Stacked | When used with Display, organizes plots to be vertically stacked on each other. |
| Bars | Creates a graph for each well in a wellplate. |
| Barstack | Creates a graph for each well in a wellplate. |
| Boxplot | Creates a graph for each well in a wellplate. |
| Dosing | Creates a graph for each well in a wellplate. |
| Heatmap | Creates a graph for each well in a wellplate. |
| Image | Creates a graph for each well in a wellplate. |
| Labeling | Creates a graph for each well in a wellplate. |
| Violin | Creates a graph for each well in a wellplate. |
| Summary | Summarizes a connected table in a different format. |
|  |
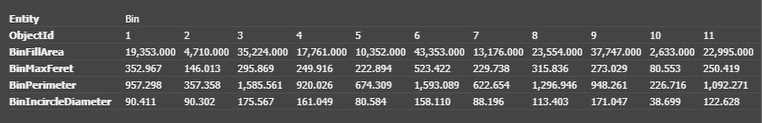
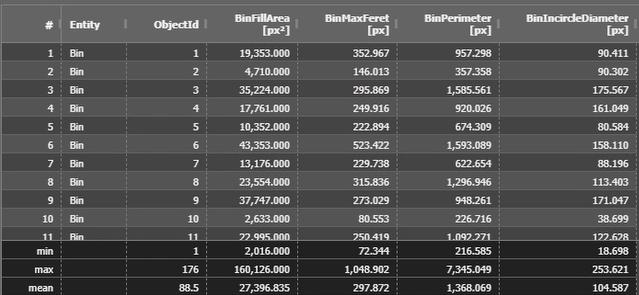
| Table | Summarizes a connected table. Can include chosen statistics to display for each column. |
|  |
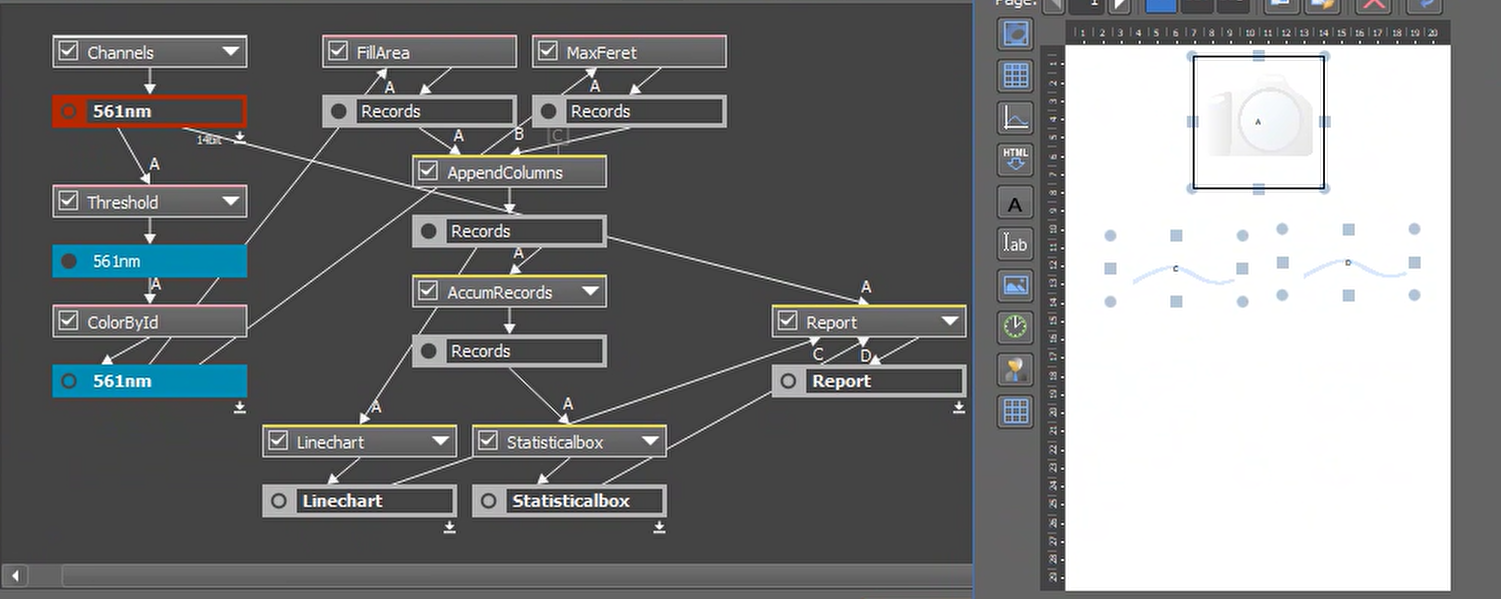
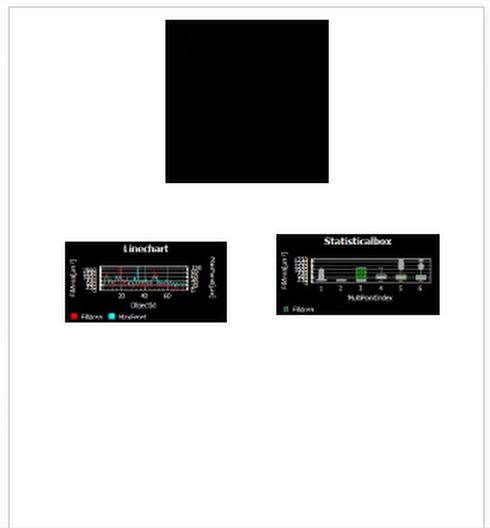
| Report | A node that designs a template for displaying images/tables/graphs. Starts out with no inputs, but as elements are added nodes can be connected to populate the template. |
 |  |
| Barchart (Legacy Graphs) | Generates a barchart from a table. Need to specify X and Y axes but can have both left and right Y axes. |
|  |
| Colormap (Legacy Graphs) | Given 3 data columns, generates a representation of a data set using X, Y, and a selected color scale. |
|  |
| Linechart (Legacy Graphs) | Generates a linechart from a table. Need to specify data for X and Y axes but can have both left and right Y axes. |
|  |
| Scatterplot (Legacy Graphs) | Generates a scatterplot from a table. Need to specify columns to use as X and Y axes and can have two Y axes. |
|  |
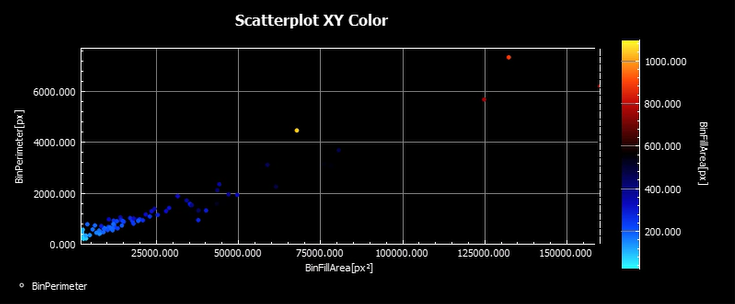
| Scatterplot XY Color (Legacy Graphs) | Generates a scatterplot with a color axis from a table. Need to specify columns to use as X, Y, and color axes. |
|  |
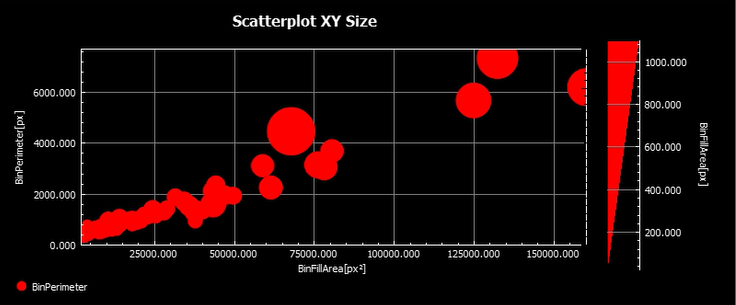
| Scatterplot XY Size (Legacy Graphs) | Generates a scatterplot with a size axis from a table. Need to specify columns to use as X, Y, and size axes. |
|  |
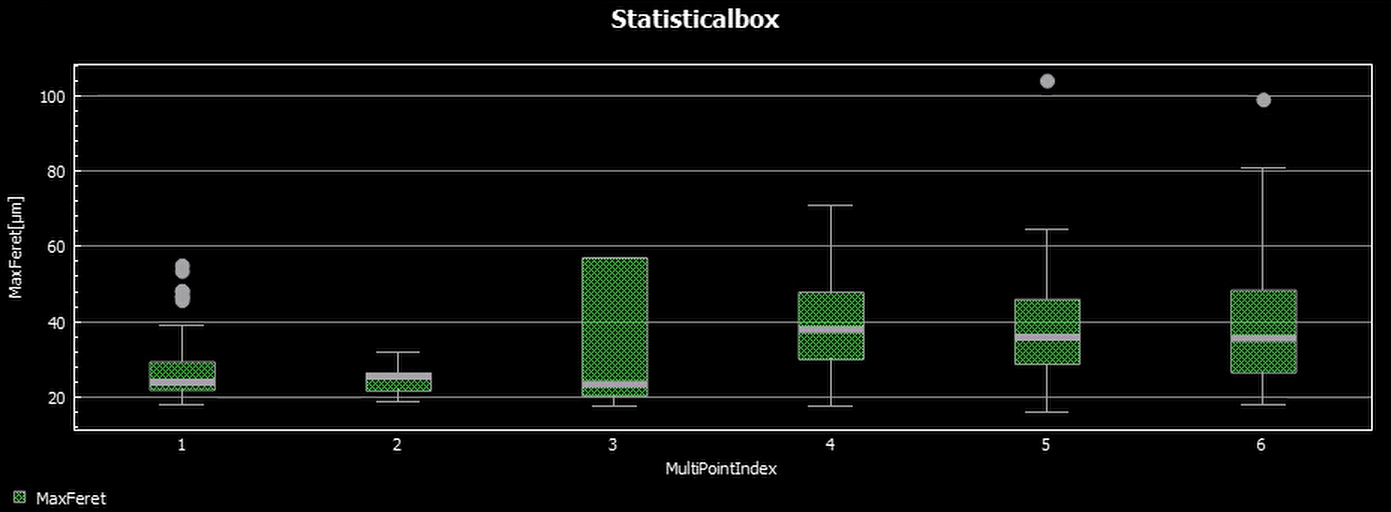
| Statistical Box (Legacy Graphs) | Generates a boxplot from a table. Need to specify data for X and Y axes and can only have one Y axis. |
|  |