| Accumulate Records | Combines measurements from an input table for all image frames. Best used on data sets like z stacks that have multiple points data is generated from. Can choose to accumulate data for timelapse only or for all loops. |
| Append Columns | Takes any number of tables with the same number of entries and condenses them into additional columns of a single table. When using measurements from the same binary layer, it is more efficient to ctrl + click to highlight the measurements and group them. However, this operation is useful for concatenating data from the same objects of interest across different binary layers. |
| Calculated Column | Takes a table as input and adds an additional column that is the output of a specified mathematical operation (ex. taking an area measurement and dividing it by 2). |
| Modify Columns | Takes a table as input and allows each column to be renamed or expressed in a different format (ex. converting large pixel areas to scientific notation). Can also specify decimal precision of data and move columns relative to each other. These operations can also be performed by clicking the gear symbol directly from the table. |
| Reduce Records | Collapses each column of a table to a specified statistic (mean, count, sum, etc.). |
| Scale Column Data | Changes every value in a specified column of a table by a chosen offset and gain. Offset 0 and gain 1 cause no change to the values. |
| Aggregate Rows | Collapses each column in a table into a single row based on parameters that can be selected for each (count, mean, a certain percentile, sum, etc.). |
| Filter Groups | Removes groups of entries in a table that do not meet the specified conditions. Options for analysis calculate the same values as Aggregate Rows. Best used after modifying groups with Group Records/Ungroup Records. |
| Group Records | Classifies objects in a table based on the selected column(s). Objects are in a single group by default. Grouping by ID will make each object its own group. |
| Ungroup Records | Undoes the effect of Group Records. May be useful to use it after Filter Groups. |
| Current Records | When used on a table accumulated over time/z position/multipoint frames, removes all entries except for those associated with the current frame. |
| Filter Records | Removes table entries that do not meet the specified criteria. Can choose column, comparator, and value. Good for removing objects that are too small, not circular enough, etc. |
| Pivot Table | Switches selected columns to rows. Several options for customizing how the table is modified. |
| Select First & Last | Removes all entries except for the first and last in a table. |
| Select Records | Selects records in a table starting from the specified row for the specified count. Ex. first row=2 and count=4 would remove all rows from the table except for 2, 3, 4, and 5. |
| Select Top | Selects certain rows of a table. Name is misleading, can choose column to filter by, how to choose what rows are included, and the number of rows to include. For example, you can select the 5 objects with the largest area by selecting FillArea for the column, sorting by Biggest, and setting count to 5. |
| Sort Records | Sorts a table’s rows using the specified column and order. |
| Append Records | Takes any number of tables that are different measurements of the same objects and combines them like Append Columns. However, the formatting is different, and each input table is given its own row.  |
| Compact Columns | Combines all columns with the same name into 1 column. Useful if you have combined tables of similar measurements. |
| Copy Column ID | Modifies column IDs from input tables so they match better and will merge when combining tables. Need to select which columns will be affected and what column to get ID from. |
| Duplicate Column | From an input table, adds a copy of the specified column. Can choose name of copy and units. |
| Join Records | Combines 2 tables with different numbers of entries (ex. cell data and nuclei data). Less useful than it sounds, the output using any join type had a number of rows equal to (rows A) * (rows B) and had a repeat of cell properties for each nucleus object. |
| New Column ID | When used before Append Columns, ensures columns are not overwritten when tables are joined. |
| Shift Records | Manipulates position of data in columns. Can choose how many rows down to shift data and how vacated rows are filled (leave them empty, fill with the original values, or wrap around from the bottom of the table). |
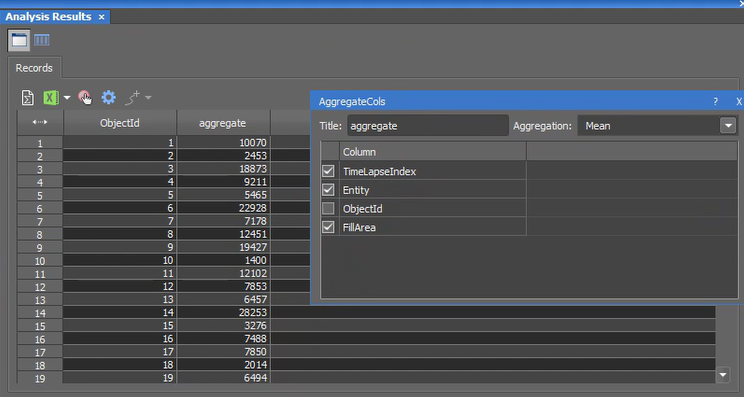
| Aggregate Columns | Combines data from each row of the selected columns based on a chosen method.  |
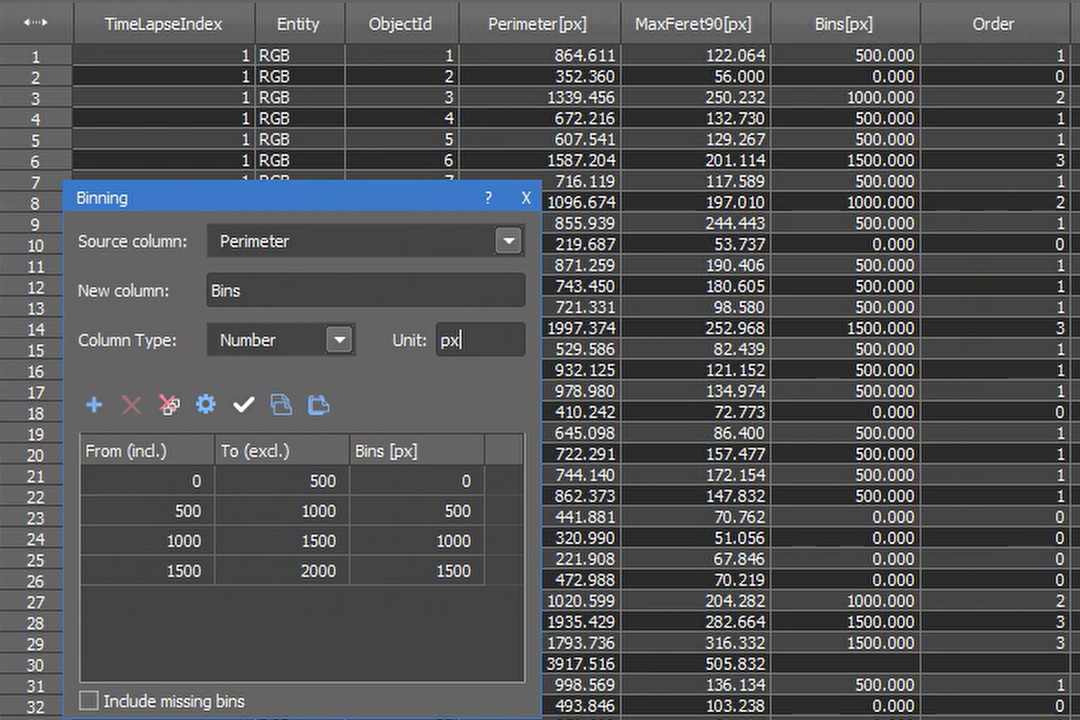
| Binning | Creates a column to bin rows of a selected source column into groups. Can choose the type of data in the bin column to be numbers or strings and units of the column. Need to use the gear to set up bins, options include logarithmic or linear. Example shown here sorts objects into 4 bins based on perimeter (objects with perimeter > 2000 are not put in a bin).  |
| Binning (simple) | Creates a column that bins rows of a selected source column. Less options than Binning, just select min, max, number of bins, and how bins are labeled. |
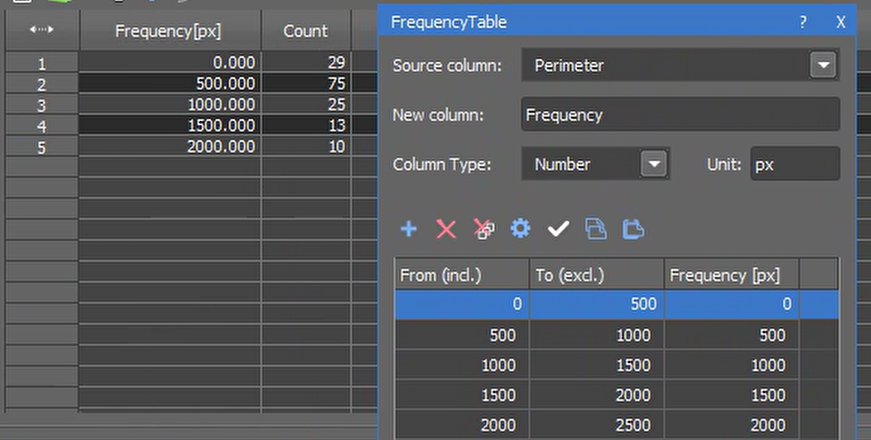
| Frequency Table | Works like Binning but collapses table into bins and the number of objects in each.  |
| Statistics | Gives selected statistics for each column of a table. Options include mean, percentiles, standard deviation, minimum and maximum, number of distinct values, etc. |
| Z-factor | Given a column containing information on where positive and negative controls are located and a column containing control values, calculates the Z-factor, which is a measure of statistical differences determined from sample means and standard deviations. |
| Addition | Uses vector addition to calculate the sum of specified positions from a table. Can choose which columns are added together, but only takes 1 table as input, so appending columns beforehand is useful. |
| Difference (vector) | Performs vector subtraction on specified columns of an input table. |
| Distance | Calculates the magnitude of the distance vector between two points specified by each row of the selected columns. |
| Vector Length | Calculates the magnitude of a vector defined by the specified columns of the input table. |
| Vector Orientation | Calculates direction of a vector defined by the specified columns of the input table in degrees from positive X-axis. |
| Stage Transformation | Given input position values, recalculates coordinates of pixels. |
| Find Local Extrema | Finds local minima and maxima in the specified column of a table and displays them in a new column. |
| Rolling Average | Calculates a rolling average of the specified column from the input table. Can choose length of window to calculate the average from (which is the number of entries before and after the center, so using a window of 3 would take an average of 7: 3 before, the value itself, and 3 after). |
| Rolling Median | Calculates a rolling median of a column, using the same window rules as Rolling Average. |
| Rolling Minimum | Calculates a rolling minimum of a column, using the same window rules as Rolling Average. |
| Rolling Maximum | Calculates a rolling maximum of a column, using the same window rules as Rolling Average. |
| Curve Fitting | Given specified dependent and independent variables, creates a column of curve values for the specified curve type using least squares. Can choose from linear, quadratic, polynomial of specified degree, exponential, etc. for curves. |
| Dose Response | Calculates points of a dose-response logistic curve fit to the specified columns representing dose and response. Can choose 4-parameter or 5-parameter curve and assign values if required. |
| Gauss Mixture | A curve fitting option for picking out multiple peaks from data. Need to specify data columns and number of peaks to find. Output shows values of the fit Gaussian functions, with one column for each peak found. |
| DBSCAN | An algorithm for classifying groups of objects into clusters. Need to specify X and Y position columns, the maximum distance an object can be from another and still be considered a neighbor, and the minimum number of neighbors an object needs to be considered part of a cluster core. Output column will show cluster ID of each object. |
| Grid Points | If table has gridline points, adds coordinates of missing points to table. |
| Parse Well Name | Using an input column that contains combined well row and column data, splits it into separate columns for well rows and well columns. |
| TMA Dearraying | Indexes a tissue microarray. If Skip Gaps is turned on, missing positions will not be skipped in numbering, otherwise index number will correspond to grid position. |
| Difference | Adds a column to a table that displays the difference between subsequent rows of the selected column. |
| Integrate | Adds a column to a table that displays the sum of all previous rows of the specified column. A constant can also be added to each entry of the sum column. |
| Position Difference | Adds columns that define components of the vector difference between consecutive points determined by the selected columns. |
| Position Integrate | Adds columns that show components of the vector sum of all previous rows of the specified position columns. |
| High Pass Filter | A high pass filter that can be applied to a column. Can select column, how filtered column loops, and alpha value (which determines filter strength). Best used on time values, did not produce a meaningful result when used on an area measurement. |
| Low Pass Filter | A low pass filter that can be applied to a column. Can select column, how the new column loops, and alpha value (filter parameters, different calculation than High Pass Filter). When used on a column of area measurements, it removed unusually high values and increased the value of smaller measurements. |
| Sequence (Int) | Creates a new column with a linear sequence of values. Can choose start value, step size, and if it should loop over different frames. |
| Sequence (Exp) | Creates a new column with an exponential sequence of values. Can choose starting value, multiplication factor, and if it should loop over different frames. |
| JS Create Column/JS Create Table/JS Scalar Expression | These options open a JavaScript dialog for coding custom table operations. Create Column fills a new column with custom coded values, Create Table makes a new table specified by a coded array, and Scalar Expression evaluates a coded expression. |